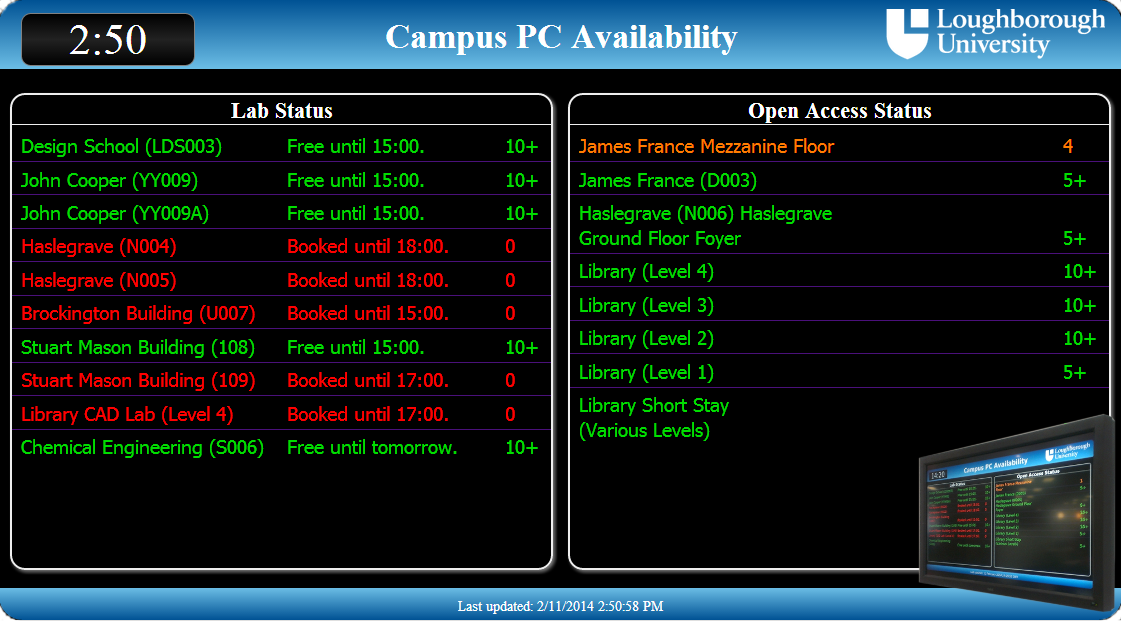
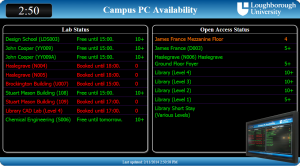
 As part of the recent refurbishment of the University Library, six digital signs were developed and installed to display room/resource bookings and the availability of computers in computer labs. The underlying technologies behind these signs are Raspberry Pi’s running Screenly OSE, an open source distribution. The content displayed is a HTML5 webpage that regularly updates its content with data retrieved from the Library’s room booking API’s and University labs usage API’s.
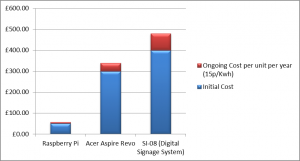
Cost comparison of Raspberry Pi and other units for driving digital signs
Raspberry Pi’s provide a significant cost saving when compared to traditional digital signage systems. The initial cost of the hardware (approximately £50) is an obvious benefit, with other digital signage computers costing between £200 and £500. There is a supplementary ongoing saving due to the power requirements of a Raspberry Pi being far lower than traditional units. In fact a potential saving of over £70 per unit per year is shown when compared to the iBase SI-08 digital signage system. Taking this a step further we can compare the units based upon their ongoing impact on the environment, where the Raspberry Pi’s low energy requirements again shows it produces far less KgCO2e (kg carbon dioxide equivalent) than the other units it was compared against.
|
Approx Cost |
Watts |
Kwh/year |
Ongoing Cost per unit per year (15p/Kwh) |
KgCO2e per year |
| Raspberry Pi |
£50 |
5 |
43.8 |
£6.57 |
19.51 |
| Acer Aspire Revo |
£300 |
29 |
254.04 |
£38.11 |
113.17 |
| SI-08 (Digital Signage System) |
£400 |
60 |
525.6 |
£78.84 |
234.14 |
Scaling the solution
While the initial digital signs were a big success there were still a number of issues that needed to be tackled before the technology could be adopted on a larger scale. The key areas that needed to be tackled were:
- Ease of installation and configuration of new units – Ideally the units should simply need plugging in to their screens, network and power and then be available.
- Devolved administration – It would be essential that individuals can administer their own units and not those owned by others.
- Ease of administration of each unit – Due to a lack of security options on the open source version of Screenly, the original units were secured by requiring an administrator to use ssh to connect to the unit before they could access the administration web interface.
To meet these requirements a new SD card image was created (based on the open source Screenly image). This image was enhanced to communicate with a new back-end system, that was developed, to manage the administration of the units. To avoid having to manually configure the network settings on each unit they use DHCP to pick up local network settings and a valid IP Address. Every time a unit is issued with a new IP Address, or renews one it has already been issued with, it checks in with the back-end system.
Each time it checks it in it passes the back-end system its current IP address and its MAC address. If the system hasn’t seen the MAC address before it creates a new unit record and populates it with the units details, if a record already exists for the unit then it’s updated with the new information.
When system administrators access the back-end system they are presented with list of any units that haven’t been assigned to a group. They can then assign the unit a name and a group. They can also add users to groups and create new groups if required.
Users can be added as either a standard user or a group administrator. Currently the only difference between the two is that a group administrator can add new users to their group and remove existing users from their groups. Each user in a group can access the administration interface of any unit assigned to that group.
In the unit’s administration interface users can add and order a number of assets to be displayed. Each asset has a name, a type (either image, webpage or video), times and dates that it is valid between and a duration of how long the asset should be displayed for. The ordering that active assets are displayed in can be adjusted by dragging an asset about the list.
One final thing to consider when scaling the solution is that the savings discussed earlier also scale. For example the six Raspberry Pi’s running in the Library have, all together, over the last five months used £16 worth of energy or to put it another way they have used £78 less energy than six Acer Aspire Revo’s would have and £180 less than six iBase SI-08 units.
We are currently testing the system with the intention of digital signs being deployed outside of University computer labs ready of the start of the new academic year.