Media coverage of the 2017 General Election campaign (report 4)
Report 4 (covering 5th May to 7th June inclusive)
This is the last in a series of weekly reports by the Centre for Research in Communication and Culture on national news reporting of the 2017 UK General Election.
The results in this report are derived from detailed content analysis of election coverage produced on every weekday (i.e. Monday to Friday inclusive) between 5th May and 7th June 2017 from the following news outlets:
- Television: Channel 4 News (7pm), Channel 5 News (6.30pm), BBC1 News at 10, ITV1 News at 10, Sky News 8-8.30pm
- Press: The Guardian, The I, The Daily Telegraph, The Times, The Financial Times, The Daily Mail, The Daily Express, The Mirror, The Sun, The Star
We analysed all election news found in the aforementioned television programmes. For the press, we included election news on the front page, the first two pages of the domestic news section, the first two pages of any specialist election section and the page containing and facing the papers’ leader editorials. More information on our methodology.1
In this report we focus on the following features of news coverage during the formal five week campaign: 1, the visibility or presence of the different political parties and other organizations and individuals in the news; 2, the most frequently reported political figure; 3, the positivity and negativity of press reporting of the main parties; and 4, which issues attracted most media attention.
Intercoder reliability tests were conducted on all key variables i.
Media coverage of the 2017 General Election campaign (report 4) (PDF)
Executive summary
- In contrast to the 2015 media election, the two main political parties dominated campaign news coverage in 2017. This two party squeeze was most evident in press coverage, with 84 percent of the featured politicians coming from the Conservatives and Labour (on TV these parties accounted for 67 percent of all politician appearances).
- There was a significant narrowing in the range of coverage compared with 2015, an election in which the minor parties had commanded significantly higher levels of news presence.
- Conservative sources gained most coverage and quotations in both press and television news. With TV the differences with their main rival were small; with the press this coverage gap was more pronounced.
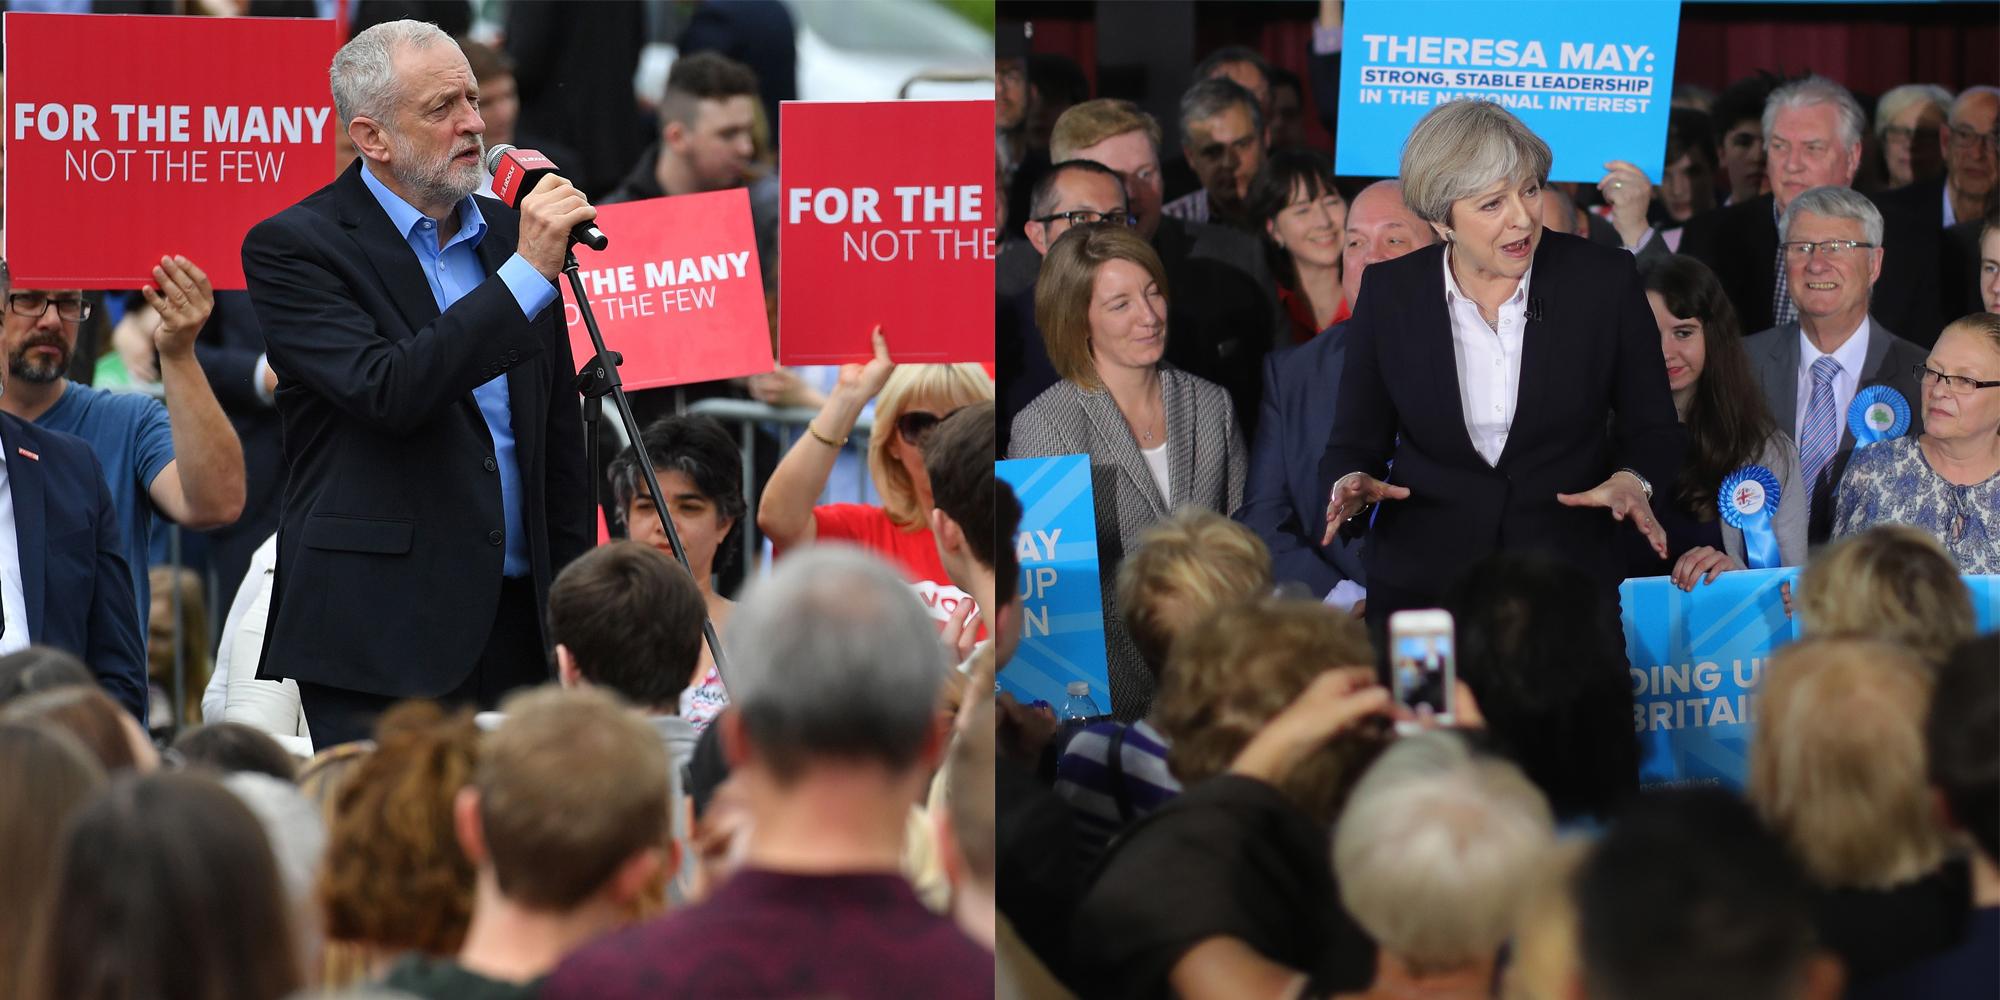
- The two main party leaders were the focus of considerable coverage. Generally, Theresa May was more prominent than Jeremy Corbyn, but in weeks 4 and 5 Jeremy Corbyn was more or equally prominent.
- Newspaper coverage was highly negative in the main – in cumulative terms no party achieved more positive than negative coverage. The most partisan newspapers gave greater editorial focus to attacking the party/parties they opposed, rather than advocating the party they supported.
- The Labour party received the most negative coverage, but the controversy and policy u-turn surrounding the Conservatives’ social care policy led to a period where media criticisms of the Tories exceeded those for Labour.
- Coverage of the electoral process itself (e.g. opinion polls, electoral events, campaign mishaps) was the most prominent issue overall. However, the levels of this coverage were appreciably lower than those found in the 2015 General Election campaign. Policy focused coverage was more prominent in this media election.
- Brexit and the EU was the most prominent substantive policy issue overall, but its relative news value fluctuated, peaking in weeks 1 and 4, but falling back in the last week of the campaign.
- The terrorist attacks in Manchester and London had a direct impact on the media agenda, bringing defence and security issues to the fore.
- Despite its importance in the 2016 EU Referendum, immigration did not make the top 5 most prominently reported issues. Coverage of this issue in 2017 matched that found for 2015.
- In total, nearly 63% of those that appeared in news were male, compared to 37% female.
Section 1: Prominence of political parties in news coverage
Figure 1.1 compares the prominence of the political parties on TV news for the sample period. Figure 1.2 makes the same comparison for national press coverage.
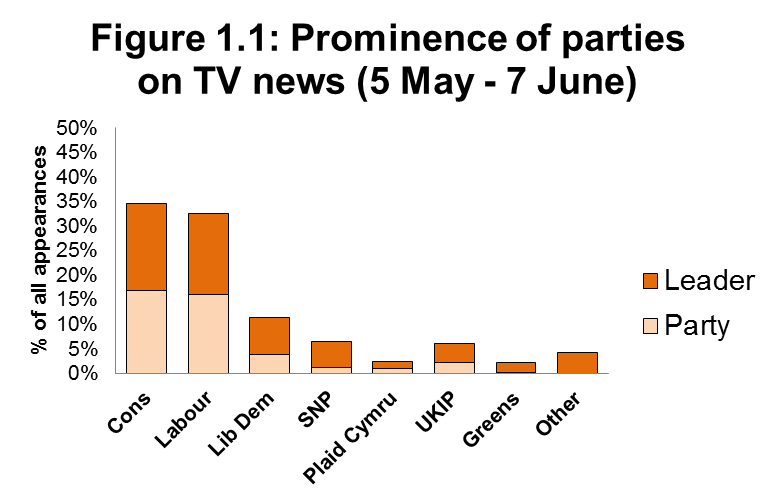
Figure 1.1 Prominence of parties on TV news
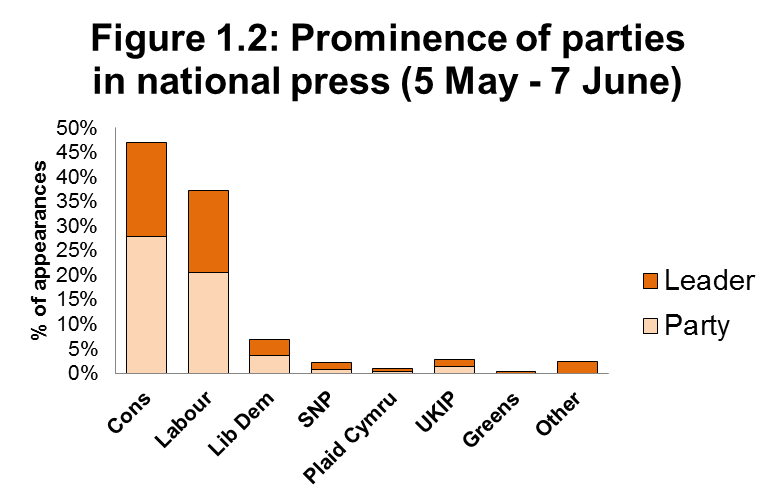
Figure 1.2 Prominence of parties in national press (5 May – 7 June)
Key findings
- Conservative party sources gained greatest prominence in TV and press coverage in terms of the frequency of their appearances.
- The margin of difference between Conservative and Labour sources was far greater in press coverage (9.6 percent) than TV (2.1 percent)
- The two main political parties dominated press coverage to a far greater extent than in TV news. In the press, Conservative and Labour sources accounted for 84 percent of all politicians reported. On TV news they accounted for 67 percent of all political appearances.
Figure 1.3 compares the amount of direct quotation of the political parties and their leaders on TV (measured in seconds). Figure 1.4 makes the same comparison for newspaper coverage (measured in words).
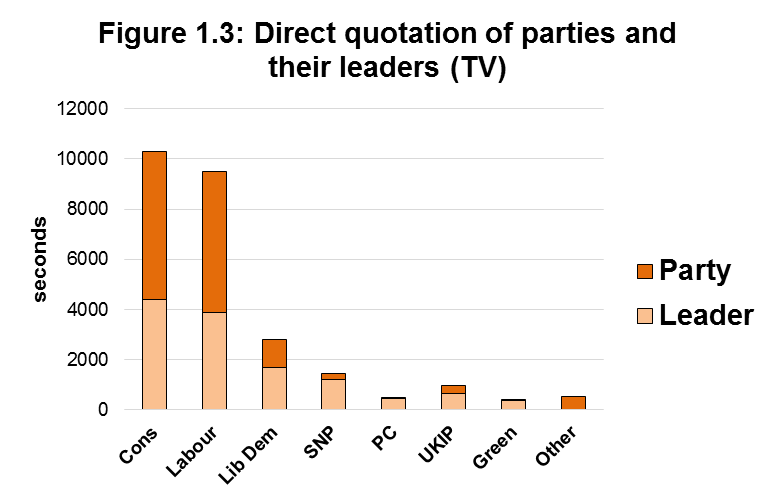
Figure 1.3 Direct quotation of parties and their leaders (TV)
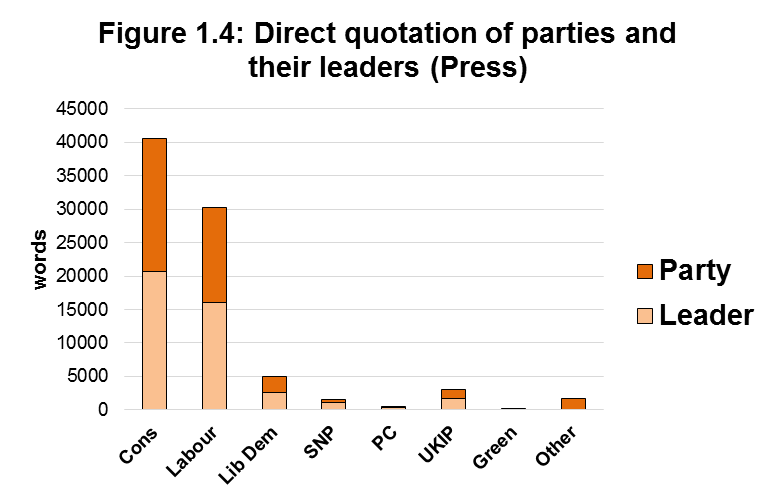
Figure 1.4 Direct quotation of parties and their leaders (Press)
Key findings
- The Conservatives received most direct quotation on TV and in the press.
- Once again, this was greater in the press than on TV, where the comparison in quotation time between the Conservatives and Labour (including between their leaders) was more balanced.
- Reflecting their reduced news presence, smaller parties received little direct quotation.
- Minor parties were quoted more on TV news than in the press. Factors relevant to this include new Ofcom guidelines for broadcasters that encourage broadcasters to take past and present electoral or polling performance into consideration as well as the potential small-scale fall out of the seven-party leadership debate, which gave the minor parties an important platform midway through the campaign.
- The leaders of each party played a prominent role in representing their party in quotation terms. This was particularly the case for the smaller parties, whose leaders tend to dominate their parties’ contributions.
Figure 1.5 compares the prominence of the political parties on TV news in the 2015 and 2017 General Election campaigns. Figure 1.6 provides the same comparison for national press coverage.
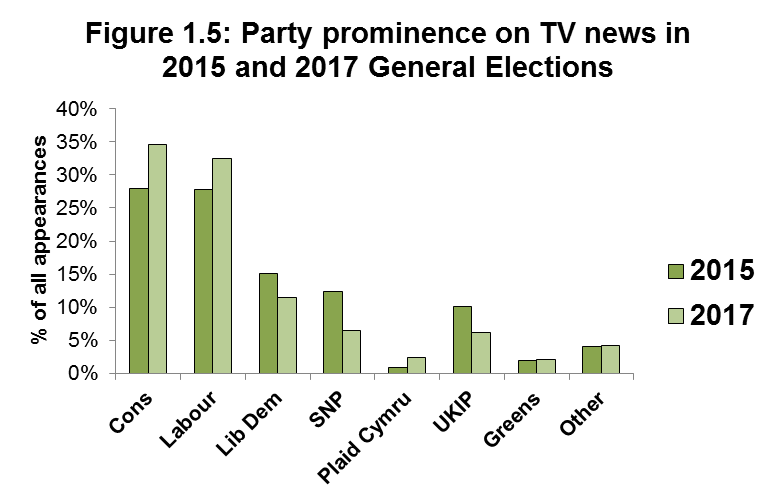
Figure 1.5 Party prominence on TV news in 2015 and 2017 General Elections
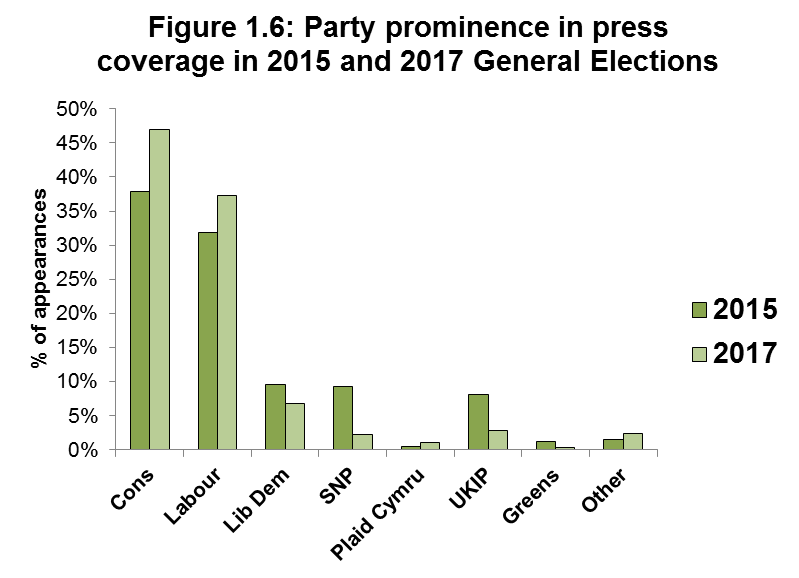
Figure 1.6 Party prominence in press coverage in 2015 and 2017 General Elections
Key findings
- Party coverage has appreciably narrowed in 2017, compared with the previous election.
- This two-party squeeze is most evident in press coverage, but the trend is also noticeable in TV news reporting.
- In 2015, 55.7 percent of all politician appearances on TV were from the two main parties. In 2017, 67.1 percent of all politicians were Conservative or Labour.
- In 2015, 69.7 percent of politicians in the press were Conservative or Labour. By 2017 this had increased to 84.3 percent.
Section 2: most prominent political figures in campaign news coverage
Table 2.1 (below) identifies the most frequently reported political figures in the news over the whole campaign period.
Table 2.1: Most prominent politicians in campaign news coverage (total news appearances)
| Position | Politician | % |
|---|---|---|
| 1 | Theresa May (Cons) | 30.1% |
| 2 | Jeremy Corbyn (Lab) | 26.7% |
| 3 | Tim Farron (Lib Dem) | 6.8% |
| 4 | Nicola Sturgeon (SNP) | 3.7% |
| 5 | Boris Johnson (Cons) | 3.6% |
| 6 | John McDonnell (Lab) | 3.4% |
| 7 | Paul Nuttall (UKIP) | 3.4% |
| 8 | Amber Rudd (Cons) | 2.8% |
| 8 | Diane Abbott (Lab) | 2.8% |
| 10 | Emily Thornberry (Lab) | 1.8% |
| 11 | Philip Hammond (Cons) | 1.7% |
| 12 | Michael Fallon (Cons) | 1.5% |
| 13 | Ruth Davidson (Cons) | 1.4% |
| 13 | Caroline Lucas (Green) | 1.4% |
| 15 | Jeremy Hunt (Cons) | 1.2% |
| 16 | David Davis (Cons) | 1.1% |
| 17 | Leanne Wood (PC) | 1.1% |
| 17 | Jonathan Ashworth (Lab) | 1.1% |
| 19 | David Cameron (Cons) | 1.0% |
| 19 | Angela Rayner (Lab) | 1.0% |
| 19 | Vince Cable (Lib Dem) | 1.0% |
Key findings:
- Over the campaign, news coverage was largely focused on the leaders of the two main parties.
- The leaders of the other parties attracted much less coverage in comparison. Tim Farron, the leader of the Liberal Democrats, received more attention than the other minor party leaders, even though his party had fewer seats going into this election than Nicola Sturgeon’s SNP (9 to 54). Leanne Wood received the lowest amount of attention in comparison.
Table 2.2 identifies the most frequently reported political figures in the final week of news coverage. It also compares their position in the previous week’s sample.
Table 2.2: Most prominent politicians in week 5 news coverage (week 4 position in brackets)
| Position | Politician | % |
|---|---|---|
| 1 (2) | Theresa May (Cons) | 30.9% |
| 2 (1) | Jeremy Corbyn (Lab) | 29.3% |
| 3 (7) | Tim Farron (Lib Dem) | 6.9% |
| 4 (8) | Boris Johnson (Cons) | 5.7% |
| 5 (3) | Diane Abbott (Lab) | 5.7% |
| 6 (4) | Nicola Sturgeon (SNP) | 4.7% |
| 7 (5) | Paul Nuttall (UKIP) | 4.1% |
| 8 (6) | Amber Rudd (Cons) | 3.2% |
| 9 (13) | Emily Thornberry (Lab) | 2.8% |
| 10 (-) | Sadiq Khan (Lab) | 2.5% |
| 11 (-) | Nigel Farage (UKIP) | 2.2% |
| 12 (-) | Justine Greening (Cons) | 1.3% |
| 12 (-) | Philip Hammond (Cons) | 1.3% |
| 12 (9) | Ruth Davidson (Cons) | 1.3% |
| 12 (12) | John McDonnell (Lab) | 1.3% |
| 12 (-) | Norman Lamb (Lib Dem) | 1.3% |
| 12 (-) | Willie Rennie (Lib Dem) | 1.3% |
| 12 (-) | Leanne Wood (PC) | 1.3% |
| 19 (15) | Karen Bradley (Cons) | .9% |
| 20 (19) | Patrick McLoughlin (Cons) | .9% |
Key findings:
- Jeremy Corbyn and Theresa May remained the most prominent politicians in the final week of the campaign.
- It was mixed fortunes for the leaders of the minor parties. Tim Farron and Leanne Wood saw their coverage increase while Nicola Sturgeon and Paul Nuttall received less coverage.
- Sadiq Khan, Mayor of London, found himself thrust into the news spotlight, although he was much less visible over the whole campaign.
Figure 2.1 shows the appearance of Theresa May and Jeremy Corbyn in coverage as a proportion of all political actors on a week-by-week basis2.
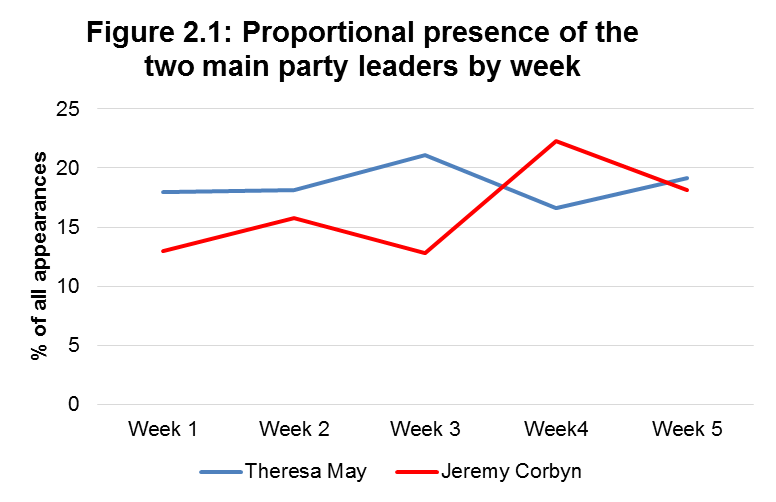
Figure 2.1 Proportional presence of the two main party leaders by week
Key findings
- Campaign coverage became more focused on the two main party leaders approaching polling day. May and Corbyn’s combined presence broadly increased from 30 percent in week 1 to a peak of 39 percent in week 4.
- Until the third week, Theresa May was more prominent than Jeremy Corbyn, but in week 4 coverage of Corbyn exceeded that of the Prime Minister. In the final week their media profiles were broadly comparable.
- The manifesto launches of both parties and the ‘leaks and tweaks’ that accompanied them3 were clearly a factor in increasing the media focus on the respective leaders.
The visibility of the DUP in the campaign
The Democratic Unionist Party will now exercise considerably more influence in Westminster than had been expected prior to the campaign when little serious consideration had been given to the possibility of a hung parliament. And whereas other challengers to the two major parties’ dominance have been partially successful in asserting themselves on the national agenda, particularly during the 2015 General Election, the DUP and the other Northern Irish parties have been pretty much ignored. The Democratic Unionists were, for instance, thwarted from appearing in the UK leader wide debates despite their vociferous protestations over their exclusion from these major televised events two years ago. Now they are centre stage in news coverage of the election post-mortems despite having been virtually invisible during the campaign (Table 2.3).
Table 2.3 shows the prominence of various DUP actors during the 2017 campaign within all political actors.
Table 2.3: Most prominent DUP politicians in campaign news coverage (total news appearances)
| DUP actor | N | % items |
|---|---|---|
| Arlene Foster (MLA, Leader and Northern Ireland First Minister) | 5 | 0.2% |
| Nigel Dodds (Deputy Leader, Westminster Leader and Foreign Affairs spokesperson) | 2 | 0.1% |
| Other DUP figure or the party in general | 3 | 0.1% |
| Total Appearances | 10 | 0.4% |
Key findings
- DUP representatives accounted for only 0.4% of media appearances in all items.
- The party’s leader and Northern Ireland’s First Minister, Arlene Foster MLA, was the party’s most prominent actor, although she appeared on only 5 occasions.
- Nigel Dodds, the party’s Westminster Leader and MP for Belfast North, appeared on only two occasions.
- These results suggest the wider national public are likely to be very unfamiliar with the party, its personalities and its politics, despite its now crucial role in supporting a Conservative-led government.
Section 3: Positive and negative treatment of the political parties in the press
In this section we discuss the overall positivity or negativity of newspaper coverage. For each item we assessed whether the information or commentary contained within it had positive or negative implications for each political party4 .
Scoring
- If an item mainly or solely focused on positive matters for a party, it was given a value of +1.
- If it mainly/ solely focused on negative matters for a party, it was assigned a value of -1.
- Items where there was no clear evaluation, or contained positive and negative issues in broadly equal measure, were coded as zero.
- Items where no reference was made to the party were excluded from the calculation.
The scores in figures 3.1 – 3.5 are calculated by subtracting the total number of negative stories from the total of positive stories.
Figure 3.1 shows the overall directional balance of stories of the respective parties.
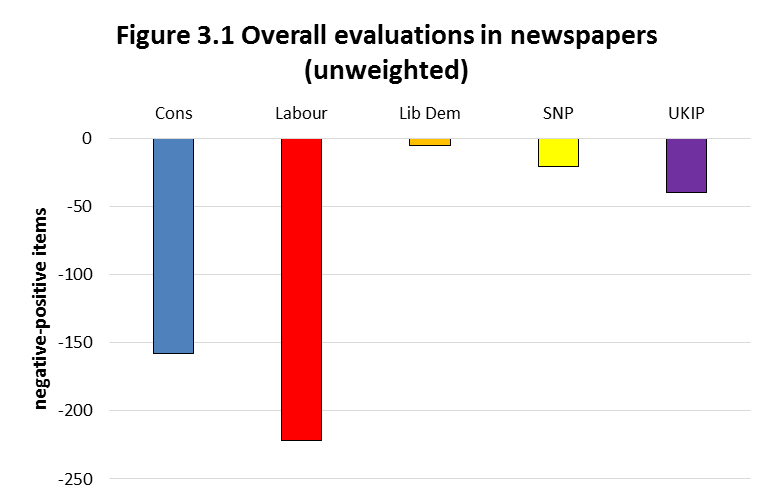
Figure 3.1 Overall evaluations in newspapers (unweighted)
Figure 3.2 weights this differential by the latest ABC circulation figures for each national newspaper.
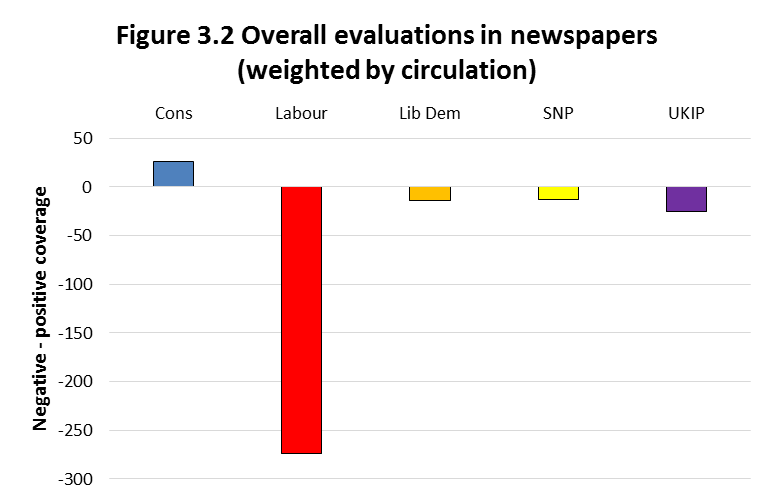
Figure 3.2 Overall evaluations in newspapers (weighted by circulation)
Key findings
- The figures for newspaper coverage, unweighted by circulation (Figure 3.1), are illustrative of a highly negative campaign – no party on this measure attained more positive than negative coverage: it was a ‘plague on (all) houses’
- With weighting for circulation (Figure 3.2), the figures reveal that, on balance, the Conservatives were alone in receiving more positive than negative coverage by a slight amount.
- Most of the Conservative party’s negative coverage came from newspapers with smaller circulations (see Figure 3.5).
- The Labour party received the most negative coverage by either measure in 3.1 and 3.2, demonstrating that the higher circulation newspapers were among the most negative towards the party.
- The Lib Dems, SNP and UKIP each received negative coverage by both measures, although this was marginal, reflecting their relatively smaller news presence.
Figure 3.3 shows the overall directional balance of stories of the respective parties for each week of the campaign.
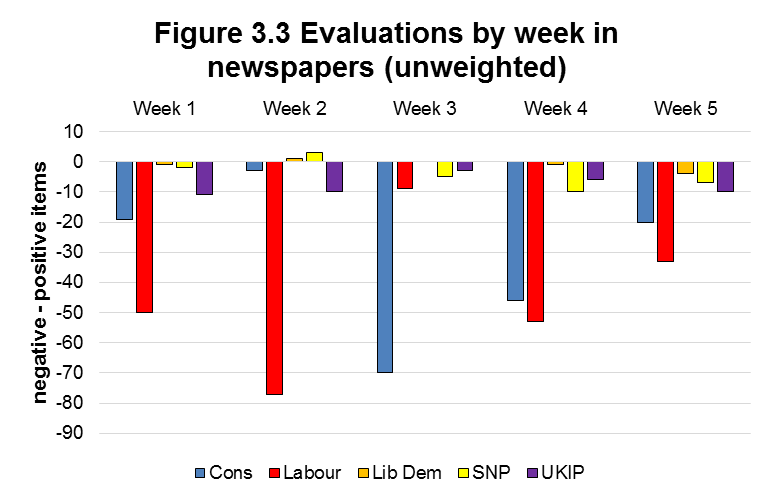
Figure 3.3 Evaluations by week in newspapers (unweighted)
Figure 3.4 provides the directional balance of stories for each week weighted by circulation.
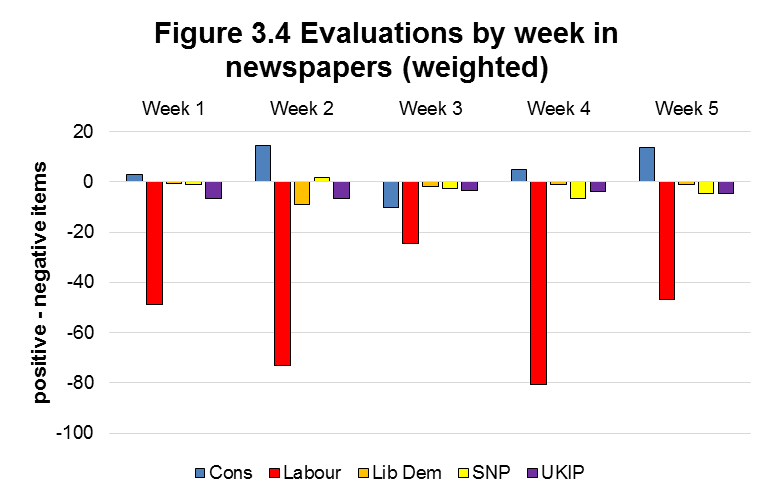
Figure 3.4 Evaluations by week in newspapers (weighted)
Key findings
- The unweighted figures show that the Conservatives began to receive much of their criticism from the press from week 3 onwards, in the aftermath of the launch of their manifesto and the ‘dementia tax’ u-turn.
- Indeed, this middle week of the campaign was the only week in which the Conservatives received more negative than positive coverage (of themselves) when evaluations are weighted for circulation.
- Things began to improve for the Tories during the last two weeks of the campaign, though this did not translate into a positive press to match Labour’s negative treatment by the newspapers.
- Week 3 was also the week in which the Labour party received their least negative coverage of the entire campaign.
Figure 3.5 breaks down the overall distribution in figure 3.1, by party and newspaper title.
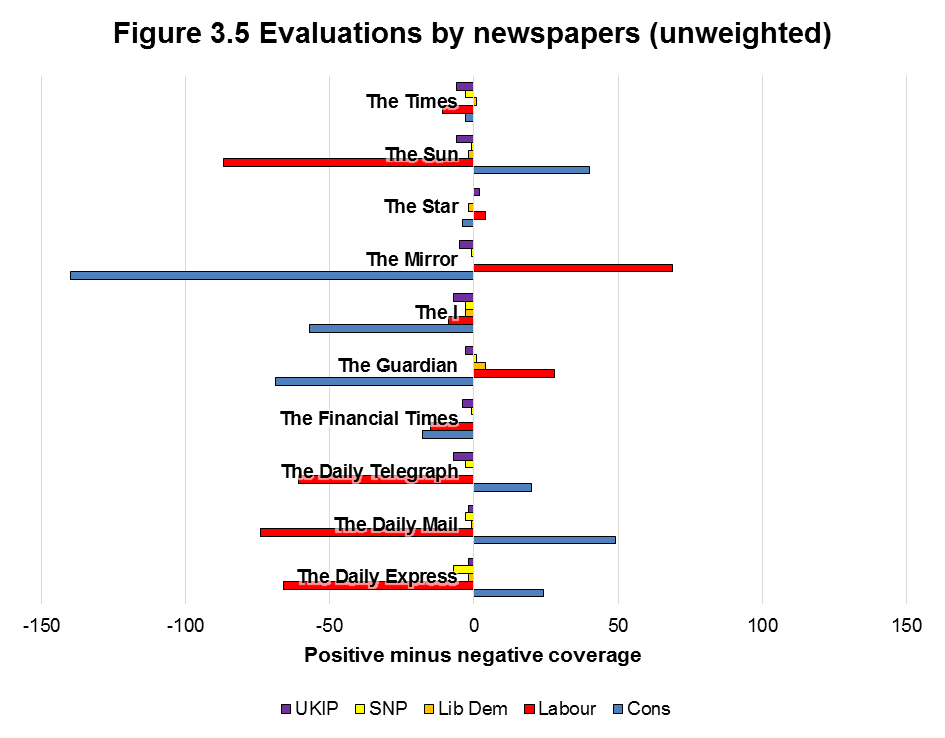
Figure 3.5 Evaluations by newspapers (unweighted)
Key findings
Figure 3.5 illustrates the partisanship of the press, with most newspapers demonstrating a clear evaluative slant towards one of the two main parties and away from the other.
- The Guardian and the Mirror were the Labour party’s backers in the press, with the Sun, Telegraph, Express and Mail providing support for the Conservatives by this measure.
- The Times, I and Financial Times are noteworthy in that they tended to be critical rather supportive where they provided evaluative coverage and so these titles’ reporting was characterised by its negativity towards both Labour and the Conservatives.
- Even where newspapers did show a clear partisan preference in their reporting, this directional balance was characterised by its greater negativity towards an unfavoured party rather than endorsement for a preferred choice. In short, the campaign was more about attack than advocacy.
Section 4: Issues in the Media Campaign
Table 4.1 compares the most prominent 10 issues in the media across the entire 2017 campaign with their relative prominence in the 2015 General Election.
Table 4.1: Most prominent issues in news coverage 2017
| Position | Issue | 2017 | % difference from 2015 |
|---|---|---|---|
| 1 | Electoral process | 32.9% | – 12.5 |
| 2 | Brexit/European Union | 10.9% | +7.8 |
| 3 | Defence/Military/Security | 7.2% | +4.7 |
| 4 | Health and health care provision | 6.7% | = |
| 5 | Taxation | 5.7% | -1.1 |
| 6 | Economy/Business/Trade | 5.5% | -5.9 |
| 7 | Social Security | 4.6% | +2.4 |
| 8 | Immigration | 4.2% | +0.8 |
| 9 | Devolution & other constitutional issues | 3.3% | -1.0 |
| 10 | Standards | 3.0% | -0.3 |
| 11 | Education | 2.9% | +1.6 |
| 12 | Public services | 2.3% | +1.7 |
| 13 | Employment | 1.6% | -0.7 |
| 14 | Housing | 1.3% | -1.5 |
| 15 | Other issues | 7.9% |
Key Findings
- Electoral process (which includes ‘horse race’ coverage) was the most prominent category but was substantially down on 2015.
- Brexit and Europe was the most prominent substantive policy issue overall.
- Coverage of defence and security issues, marginal in 2015, was much more prominent in 2017 following controversies over Trident and responses to the Manchester and London terror attacks.
- Coverage of business and the economy was much less prominent in 2017 than in 2015. In previous elections, the economy has proved to be the most reported policy issue and in recent years has been an issue widely perceived as being owned by the Conservative Party. In this election, coverage of the economy and business was far less prominent than in 2015, and became more marginal as the campaign progressed (see figure 4.1).
- Despite its importance in the 2016 EU Referendum, the issue of immigration remained as marginal in 2017 as in 2015.
- Coverage of health and health care was as prominent in 2017 as it was in 2015.
- Education issues in 2017 (notably school meals and tuition fees) received more attention than in 2015.
- Despite their obvious considerable importance, issues of housing, transport and the environment were rarely reported either in 2015 or in 2017.
Figure 4.1 compares the proportional prominence of some of the main issues across the weeks of the campaign.
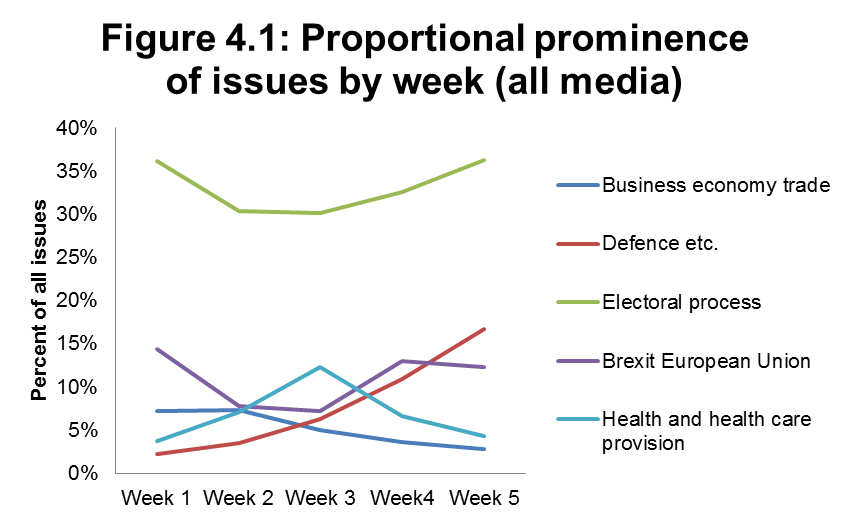
Figure 4.1 Proportional prominence of issues by week (all media)
Key Findings
- For what was supposed to be ‘the Brexit election’, the Conservative Party struggled to get the media to define it as such from the second week of the campaign onwards.
- The rise of Health and Health care in week 3, and the rise of Defence related issues in the last two weeks, show the extent to which the Conservative campaign was blown off course by the ‘dementia tax’ u-turn and then by security issues in the aftermath of the Manchester and London Bridge terrorist attacks.
- Coverage of the electoral process itself dipped through the middle three weeks of the campaign.
Section 5: Gender Balance of Campaign News
Figure 5.1 shows the different types of people who appeared in the news by their gender over the campaign period.
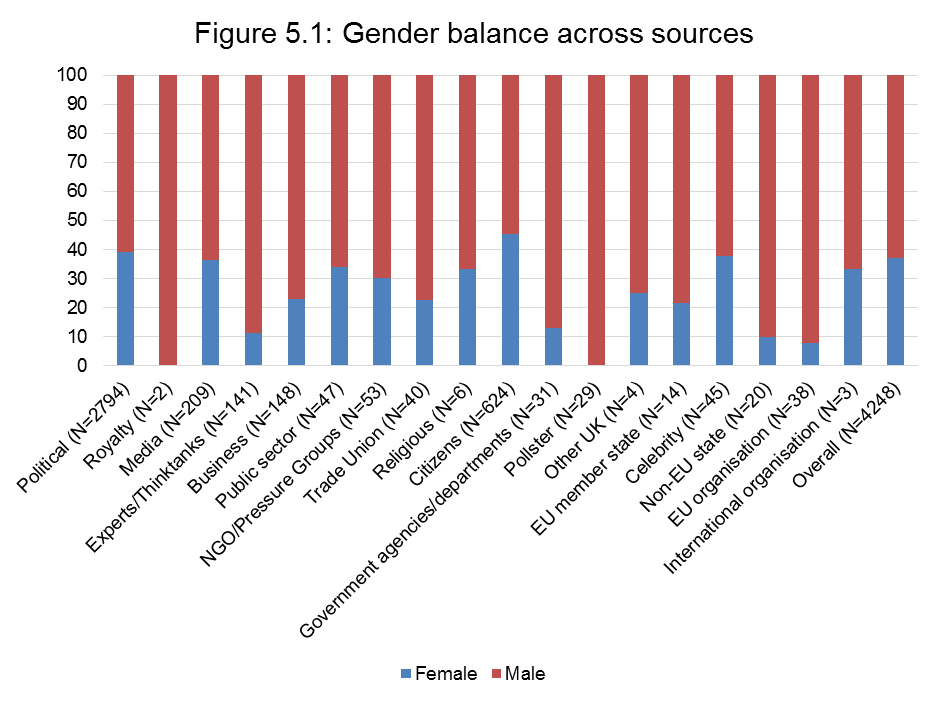
Figure 5.1 Gender balance across sources
Findings
- In total, nearly 63% of those that appeared in news were male, compared to 37% female.
- Amongst politicians the split was 60/40 per cent in favour of men.
- Outside of the political party arena, men were consistently over-represented relative to women across all professional and public categories
Sample days for the respective weeks were the weekdays between: 5th May to 11th May (week 1), 12th to 18th May (week 2), 19th to 25th May (week 3), 26th May to 1st June (week 4), 2nd to 7th June (week 5).
The Labour party manifesto was leaked in advance of its official launch. Three days after the launch of the Conservative manifesto, the party made a u-turn on its proposals for social care reform.
This is not solely a measure of overt support or criticism by a journalist of a party (although these instances would be included in the count). It is a broader measure of the extent to which newspapers report on issues/comments/developments that have positive or negative implications for parties. We only coded these instances where these were overtly referred to in the piece.
Our thanks to our coding team: Shani Burke, Gennaro Errichiello, Simon Huxtable, Jack Joyce, Herminder Kaur, Jade Markham, Nathan Ritchie, Lukas Stepanek, Ian Taylor, Rosie Tinker and Lou Tompkins
Inter-coder reliability UK General Election 2017 campaign analysis
A reliability test using a random sample of 11 newspaper stories was conducted early on in the coding process with 10 coders. It is customary to provide an inter-coder reliability measure for each variable on a coding sheet. We have focused here on the more subjective variables that require coder judgement and the scores below are for these variables on the coding sheet.
Two measures are used, average pairwise percent agreement (APPA) and Krippendorff’s Alpha. Given the number of coders and the amount of training time ahead of this snap election our confidence level was set at 70% for APPA and 60% for Krippendorff’s Alpha.
The identity of actors in the news: APPA 78.324%; Krippendorff’s Alpha, 0.733776976662
Disposition of actors in the news: APPA, 72.9761904762% Krippendorff’s Alpha. 0.633986079743
The themes of news items: APPA, 76.2962962963%; Krippendorff’s Alpha, 0.684490950537
Overall story evaluation: APPA, 86.7824074074%; Krippendorff’s Alpha, 0.644939179375