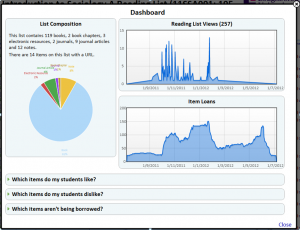
 In 2012 we produced a dashboard for our reading list system that allowed academics to see how (and if) their reading list were being used. This proved to be a great success both with the academics and also in terms of the approach taken to develop it. So a year later when there was a need to produce some statistics from the newly installed access control system in the Library we choose to repeat ourselves.
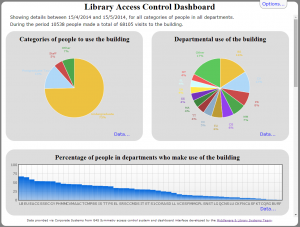
We were supplied with the log files from the access control system and enriched this with additional information from the Library Management System. A database was created and associated script developed to regularly import the information into the database. A small series of CGI scripts were also produced to extract information from the database and return the results in JSON/JSONP format, which was in turn is processed the front end HTML5 web page using appropriate plug-ins. The dashboard has been used by the Library to promote the success of its recent extension and refurbishment and is being used to monitor occupancy levels (particularly during peak periods such as exams).
And then we did it again!
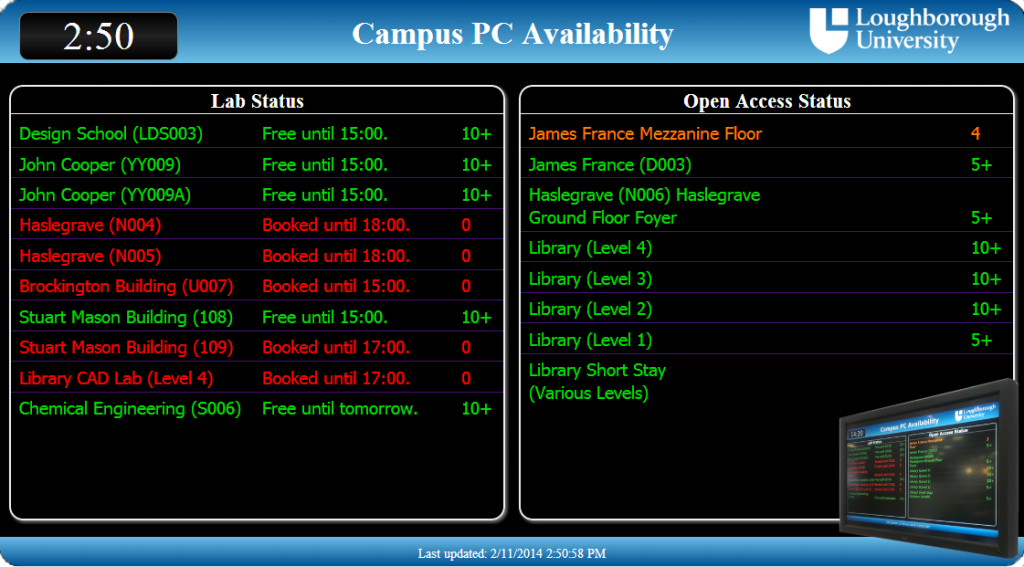
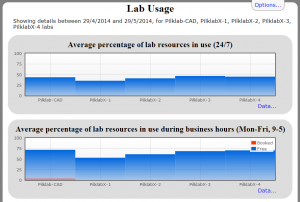 By taking a snapshot of the lab availability system every fifteen minutes and putting the resultant information into a simple database, we used the same tools to develop another dashboard recently to show the use of IT Services managed Lab PCs across the campus. IT staff can now see the occupancy of these labs over time, when they were booked and even see a map of PC hot spots.
So basically our philosophy seems to be: You’re having a dashboard! You’re having a dashboard! The whole INSTITUTION’s having a dashboard! They’re having a dashboard!

