Media coverage of the 2017 General Election campaign (report 1)
This is the first of a series of weekly reports by the Centre for Research in Communication and Culture on national news reporting of the 2017 UK General Election.
The results in this report are derived from detailed content analysis of election coverage produced on the weekdays (i.e. Monday to Friday inclusive) between 5th and 10th May from the following news outlets:
Television: Channel 4 News (7pm), Channel 5 News (6.30pm), BBC1 News at 10, ITV1 News at 10, Sky News 8-8.30pm
Press: The Guardian, The I, The Daily Telegraph, The Times, The Financial Times, The Daily Mail, The Daily Express, The Mirror, The Sun, The Star
We analysed all election news found in the television programmes. For the press, we included election news found on the front page, the first two pages of the domestic news section, the first two pages of any specialist election section and the page containing and facing the papers’ leader editorials. Our methodology.
In this report we focus on the following features of news coverage during the opening stage of the formal campaign: 1, the visibility or presence of the different political parties and other organizations and individuals in the news; 2, the quotation time given to these individuals and institutions; and, 3, which topics attracted most media attention.
Executive summary
- The Conservatives dominated mainstream news media coverage in the first week of the campaign. They were the most frequently reported party and the most extensively quoted. Their lead in coverage and quotation terms was particularly notable in national press coverage, with their current dominance building upon the considerable advantages they enjoyed in the 2015 General Election.
- The advent of multi-party politics in the UK – much discussed in the previous election – is currently in abeyance, at least in national media terms. All the minor parties had a reduced presence in the first week of the 2017 campaign, when compared with the same period of the 2015 General Election.
- The dominance of the two main parties was most apparent in press coverage, but it was also evident in TV news coverage. The SNP and UKIP were the parties who lost greatest ground in comparison with their national media exposure in 2015.
- The two main party leaders were the most dominant figures in coverage by a considerable margin. The appearance of Phillip May, the Prime Minister’s husband, on the BBC1 entertainment programme, the One Show, in the middle of the week, propelled him to become the 5th most prominent political personality reported in the first week’s coverage.
- Our analysis of the issues confirms the extent that Brexit has dominated the media campaign in this initial period. The next most prominent substantive issues were the economy and business. These represent matters that the Conservative party would prefer to focus upon in their campaigning. Issues that the Labour opposition have sought to prioritise, such as health and education, have thus far been marginalised.
- The side-lining of the nationalist parties seems also to have limited discussion of devolution and related matters.
- Despite the prominence of Brexit, coverage of immigration, which was a touchstone of the 2016 EU Referendum campaign, was comparatively limited in the first week of the campaign.
Section 1: News presence of the political parties
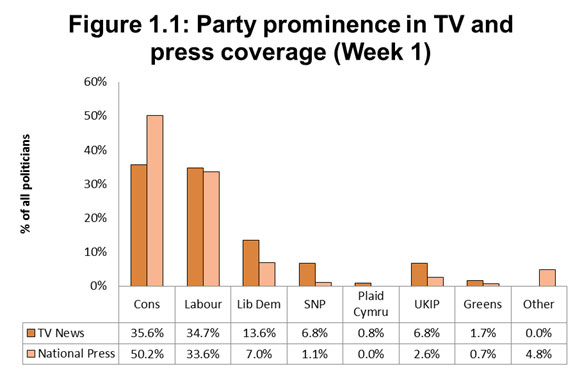
Figure 1.1: Party prominence in TV and press coverage (Week 1)
Figure 1.1 shows the frequency of appearance of the political parties in the sampled coverage, differentiated by news sector.
Key findings
- On TV, Conservative and Labour made similar levels of appearances.
- In the press, Conservative appearances exceeded those of Labour by 17 percent.
- On TV, the two main parties accounted for 70 percent of all party appearances.
- In the press, the two main parties accounted for 84 percent of all party appearances.
Table 1.1 compares these distributions with those found in the identical time period of the 2015 General Election .
Table 1.1: Comparison of the proportion of coverage of parties in the first week of the 2015 & 2017 UK General Elections.
| 2015 | 2017 | |||
|---|---|---|---|---|
| TV | Press | TV | Press | |
| % | % | % | % | |
| Conservative | 26.8 | 35.3 | 35.6 | 50.2 |
| Labour | 33.6 | 29.9 | 34.7 | 33.6 |
| Lib Dem | 14.8 | 10.0 | 13.6 | 7.0 |
| SNP | 11.4 | 8.4 | 6.8 | 1.1 |
| Plaid Cymru | 0.7 | 1.2 | 0.8 | 0.0 |
| UKIP | 9.4 | 12.7 | 6.8 | 2.6 |
| Greens | 0.0 | 0.9 | 1.7 | 0.7 |
| Other | 3.4 | 1.5 | 0.0 | 4.8 |
Note: percentages=(frequency of appearance/total number of politicians)*100
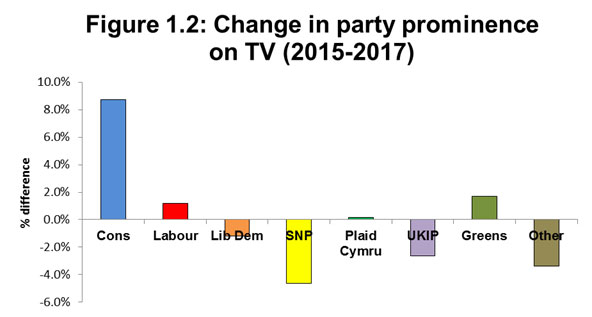
Figure 1.2: Change in party prominence on TV (2015-2017)
Figure 1.2 compares the extent to which the proportional presence of each party in TV news has increased or decreased in this election compared with 2015. Figure 1.3 compares the same differences for newspaper coverage.
Key findings
- There has been a marked diminution in the news presence of the minor parties in 2017, compared with the 2015 campaign.
- This reduction is most evident in newspaper coverage, with UKIP’s news presence reducing by a tenth, SNP by 7 percent and the Liberal Democrats by 3 percent.
- On TV, the SNP has seen the greatest reduction in its news presence (5 percent), followed by UKIP (3 percent) and the Liberal Democrats (1 percent).
- In both TV and newspaper coverage, it is the Conservative party that has increased its news presence most significantly.
- The increase in TV news is to a large extent a product of the Conservatives’ lower news presence relative to Labour in the first stages of the 2015 campaign.
- The Conservatives’ large increase in press coverage in 2017, builds on their higher news presence at the same stage of the 2015 election campaign.
Section 2: Top twenty politicians
Table 2.1 lists the top 20 most prominently reported political figures during the first week of the campaign .
Table 2.1: Most prominent politicians in Week 1 coverage
| Rank | Individual | % |
|---|---|---|
| 1 | Theresa May (Cons) | 32.4% |
| 2 | Jeremy Corbyn (Lab) | 21.4% |
| 3 | Tim Farron (Lib Dem) | 6.4% |
| 4 | John McDonnell (Lab) | 6.1% |
| 5 | Philip May (Cons) | 4.3% |
| 6 | Donald Tusk (EU) | 2.9% |
| 7 | Paul Nuttall (UKIP) | 2.6% |
| 8 | Nicola Sturgeon (SNP) | 2.6% |
| 9 | Jeremy Hunt (Cons) | 2.3% |
| 10 | Amber Rudd (Cons) | 2.3% |
| 11 | David Davis (Cons) | 2.0% |
| 12 | Jean-Claude Juncker (EU) | 2.0% |
| 13 | Emmanuel Macron (EU) | 1.7% |
| 14 | Greg Clark (Cons) | 1.4% |
| 15 | David Cameron (Cons) | 1.4% |
| 16 | Ruth Davidson (Cons) | 1.4% |
| 17 | Emily Thornberry (Lab) | 1.4% |
| 18 | Ed Miliband (Lab) | 1.4% |
| 19 | Vince Cable (Lib Dem) | 1.4% |
| 20 | Patrick McLoughlin (Cons) | 1.2% |
Note: percentages=(number of appearances/ number of items)*100
Key findings
The Prime Minister, Theresa May was featured as an active contributor in nearly one third of all election items.
- Jeremy Corbyn, Labour Leader, was the second most prominently featured, appearing as an active contributor to just over one-in-five of all items.
- Philip May, husband of the Prime Minister, received more coverage than the leader of the SNP (Nicola Sturgeon) and UKIP (Paul Nuttall).
- The results and implications of the final round of the 2017 French Presidential Election also resonated in UK General Election news, with Emmanuel Macron being the 13th most frequently reported.
- Donald Tusk (President of the European Council) and Jean-Claude Juncker (President of the European Commission) were respectively 6th and 12th most prominently featured.
- Phillip Hammond, the Chancellor of the Exchequer, did not make this list,
Discussion
These results reveal some significant shifts in the early coverage of this campaign compared with the same period of the 2015 General Election. So far, the minor parties have gained far less traction in media terms, with Conservative and Labour commanding higher levels of coverage in both TV and press terms than at the equivalent point two years ago. Of these two parties, it is the Conservatives that made the greatest gains.
The reasons for these changes can only be speculated upon, but we note they have occurred in the context of a new regulatory framework for broadcast news .
This two party squeeze has been most pronounced in press coverage, where the Conservatives’ greater prominence in 2015 has been extended further. The list of the most frequently reported politicians shows the dominance of the two main party leaders, particularly the Prime Minister.
A further measure of her news value is the amount of coverage given to her husband, Phillip May, following his appearance with her on the BBC One Show in mid-week. In contrast, the Chancellor, Phillip Hammond, did not make the top twenty list of most frequently reported political figures.
The shadow of Brexit is also revealed with three EU leaders making appearances in the rankings.
Section 3: Quotation time allocated to political parties (News access)
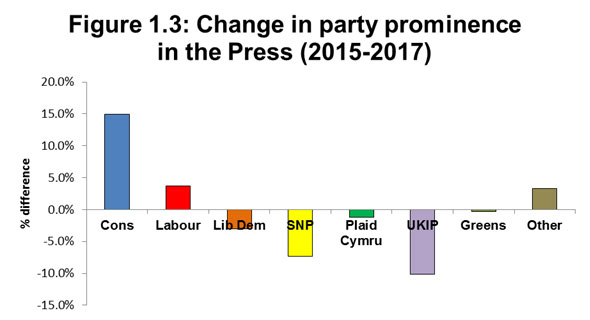
Figure 3.1: Direct quotation of parties and their leaders (TV)
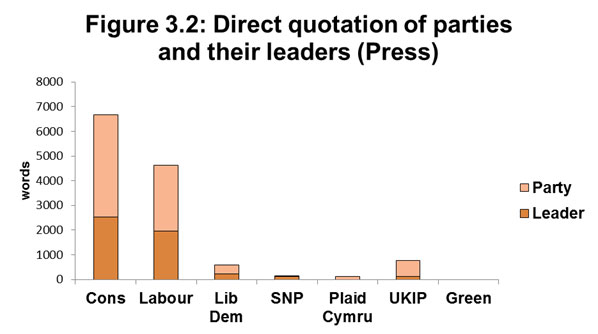
Figure 3.2: Direct quotation of parties and their leaders (Press)
Figure 3.1 compares the amount of direct quotation of the political parties and their leaders on TV (measured in seconds). Figure 3.2 makes the same comparison for newspaper coverage.
Key findings
- The Conservatives have received most direct quotation in both TV and Press coverage so far. In TV coverage, their direct quotation exceeds that for Labour by 27 percent. In newspaper coverage, the quotation gap is 45 percent.
- However, Jeremy Corbyn’s direct quotation time exceeds that for Theresa May in TV coverage.
- Reflecting the findings of the previous section, minor parties are struggling to get their voices heard. On TV, Conservatives and Labour accounted for 75 percent of the quotation time for the five main parties, and for 87 percent of the press coverage.
- Regarding UKIP, Paul Nuttall is the main voice of UKIP in TV coverage, whereas he is far less prominent in press coverage.
Section 4: The top issues in the media campaign
Table 3.1: Ten Most Prominent Issues in Coverage (Week 1)
| Place | Issue | Percentage of issues |
|---|---|---|
| 1 | Election Process | 38.1% |
| 2 | Brexit/ European Union | 16.2% |
| 3 | Economy/ Business/Trade | 6.8% |
| 4 | Standards | 4.9% |
| 5= | Taxation | 4.5% |
| 5= | Immigration | 4.5% |
| 7 | Health and health care provision | 3.6% |
| 8 | Social Security | 2.9% |
| 9 | Education | 2.8% |
| 10 = | Employment | 1.5% |
| 10= | Devolution | 1.5% |
Percentages=(frequency of issue/total number of issues coded)*100
- As in previous General Elections a substantial portion of the coverage concerns the electoral process itself and what the final ballot might mean for the prospects of each of the parties.
- The most prominent substantive issue by a considerable margin is Brexit, which is potentially good news for the Conservative Party as this is the issue on which they wish to fight the General Election.
- Immigration as an issue is not as prominent as might have been expected, given that it was a touch stone issue in the 2016 referendum campaign.
- The next most prominent issue is business and economy, again good news for the Conservatives as opinion polls suggest they lead on the stewardship of the economy.
- Conversely, health and education, issues on which the Labour Party wish to campaign, are much less prominent.
- The issue of devolution just about makes it into the top 10 suggesting that the Scottish (or indeed the Irish) issue has not featured prominently yet.
Discussion
So far the media attention in the General Election campaign has been largely focused on Brexit. The Conservatives have sought to use the issue to contrast the supposed desirability of Theresa May’s ‘strong and stable leadership’ with that on offer from Jeremy Corbyn. Conversely, the Labour Party have struggled to carve out a strong position on this. Other issues which the other parties have put forward on health, education, devolution, social security, housing and environment have received much less coverage. But these are early days and we will have to see whether Brexit continues to overshadow these and other issues.
General Election 2017: The Media Campaign Report 1 (PDF)
Our thanks to our coding team: Shani Burke, Gennaro Errichiello, Simon Huxtable, Jack Joyce, Herminder Kaur, Jade Markham, Nathan Ritchie, Lukas Stepanek, Ian Taylor, Rosie Tinker and Lou Tompkins
All percentages in the commentary are rounded.
The 2015 figures are taken from Loughborough University CRCC’s 2015 General Election study and represent coverage produced at an identical time period to the 2017 sample set.
To be included in this count, a politician had to have an active role in a news item or commentary piece – i.e. they were reported as saying or doing something. References made to them by other persons would not qualify them for inclusion in this measure.
In March 2017 Ofcom announced it was abandoning the concept of ‘larger party’ status, which required broadcasters to apportion significant coverage to any party deemed to have attained this position. In the regulator’s words: ‘Having considered all the responses, we consider it appropriate to remove the concept of larger parties from our rules and to replace it with a requirement on broadcasters to take election-related editorial decisions and decisions about allocations of PEBs and PPBs by reference to evidence of past electoral support and/or current support.’ (see Statement on Ofcom’s rules on due impartiality, due accuracy, elections and referendums, Ofcom’s rules on due impartiality, due accuracy, elections and referendums: 1) Removing the list of larger parties 2) Applying the rules to the BBC. )