Media Coverage of the 2015 General Election (Report 2)
This is the second of a series of reports by the Loughborough University Communication Research Centre on national news reporting of the 2015 UK General Election.
The results in this report are derived from detailed content analysis of election coverage produced on the weekdays (i.e. Monday to Friday inclusive) between 30th March and 15 April from the following news outlets:
Television: Channel 4 News (7pm), Channel 5 News (6.30pm), BBC1 News at 10, ITV1 News at 10, BBC2 Newsnight, Sky News 8-8.30pm
Press: The Guardian, Independent, Times, Daily Telegraph, Daily Mail, Daily Express, Mirror, Sun, Star and Metro.
We analysed all election news found in the entire duration of all television programmes. For the press, we included election news found on the front page, the first two pages of the domestic news section, the first two pages of any specialist election section and the page containing and facing the papers’ leader editorials.
Key findings
Our analysis is organised under five sections:
1. Stopwatch balance
Key findings
- A ‘quotation gap’ has opened up in TV coverage, with the Conservative party receiving 6.6% more speaking time than Labour.
- However, there is no ‘appearance gap’ between the two main parties in TV coverage. Conservative and Labour representatives featured in similar amounts.
- In national press coverage there are both ‘quotation gaps’ and ‘appearance gaps’ that favour the Conservative party.
- The challenger parties have retained their presence, to some degree, with some making ground (Greens) and others losing it (Plaid Cymru and SNP).
2. Coverage of the Challenger parties in historical perspective
Key findings
- Overall, there is no sign that the established parties are squeezing out the challenger parties.
- The low levels of coverage given to Plaid Cymru and the Green party are entirely consistent with patterns found in every General Election since 2001.
- Coverage of the SNP and UKIP in 2015 exceeds their levels of coverage in previous elections to a dramatic extent.
3. Issue balance
Key findings
- Coverage of the election process itself (campaigning, strategies, polls etc) continues to dominate.
- Economy and taxation retain their position as the most prominent substantive issues.
- Housing and Defence have gained greater prominence.
- Immigration, NHS and Employment have become less prominent.
- Many of the issues associated with particular challenger parties are marginal (e.g. the environment and devolution). The increased plurality in participants has not pluralised the range of media debate.
4. Who was in the spotlight?
Key Findings
- The three main party leaders, predictably, remain ‘non movers’ at the top of the chart.
- Cameron and Miliband have commanded a higher proportion of individual appearances this week.
- Natalie Bennett of the Green party has moved up to 9th place, up from 20 last week.
- The highest new entry was Michael Fallon at 6.
5. Where are the Women?
Key Findings
- Women account for less than 1 in 5 of the individuals featured in election news coverage (19%).
- This figure represents an increase of about 5% in comparison with the last 3 UK General Elections.
- Only 14% of the politicians featured so far are women.
- Women were similarly rarely reported in various other professional capacities (e.g. as business spokespeople, experts, public professionals).
- They were more frequently featured as electors/ citizens, but even here they failed to achieve parity with men (46.5%).
- The one category women dominated was ‘politicians’ relative’ (80%).
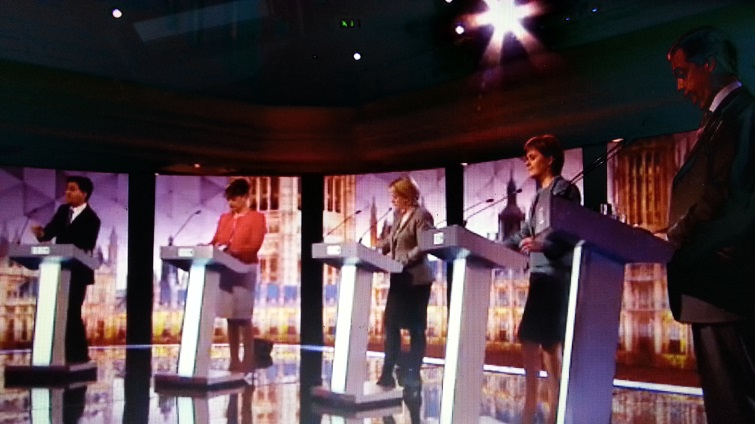
Section 1: Stopwatch balance (30 March – 15 April)
Our first measure for comparing the amount of media coverage of the main contenders in the election involves counting the amount of direct quotation of politicians in reporting (for TV this is counted in seconds, for Newspapers in words). The results of these calculations are set out in Figures 1.1 & 1.2.


The findings show:
- A ‘quotation gap’ has opened up in Television coverage between the Conservatives and Labour, with Conservative ‘speaking time’ exceeding their opponents by 6.6%. This represents a considerable shift from our first report, which analysed coverage between 30 March and 8 April and found near parity between the parties.
- There is an even greater ‘quotation gap’ in national press coverage, with direct quotation for the Conservatives exceeding Labour by 10.6%. This gap was also evident in our earlier sample.
- There is a greater ‘two party squeeze’ in the national press, where Conservative and Labour account for 72.53% of all quotation. In national TV the figure is 63.97%
- Of the other challenger parties, the Liberal Democrats and then UKIP have attracted most quotation time.
- The SNP and Plaid Cymru’s presence has receded since our first report.
- ‘Speaking time’ for the minor parties is particularly ‘presidentialised’, as in each case the party leader’s quotation exceeds that of all other party representatives.
Our second measure in assessing the degree of the balance in the reporting of parties is to quantify the frequency of appearance of party sources (i.e. including occasions when they are not directly quoted). This is a broader measure of news presence. The results of this comparison are set out in Table 1:
Table 1: Frequency of appearance
| TV | Press | |
| Conservatives | 28.8% | 37.8% |
| Labour | 29.7% | 33.4% |
| Lib Dem | 15.2% | 9.8% |
| SNP | 8.8% | 6.1% |
| Plaid Cymru | 1.7% | 0.6% |
| UKIP | 10.9% | 9.3% |
| Greens | 2.6% | 1.4% |
| Other | 2.3% | 1.5% |
Note: Percentages=number of appearances of party/ total appearances of all parties
When this measure of balance is taken, the following points emerge:
- In television terms, there is no ‘appearance gap’ similar to the ‘quotation gap’ noted in the reporting of the main parties. Indeed, Labour party sources are featured slightly more frequently than Conservatives.
- In press coverage, there is an appearance gap in favour of the Conservatives, but the differential is far lower than was found in quotation time.
- The proportional prominence of UKIP and the SNP is higher in this measure than in quotation, both in press and TV coverage.
Section 2: Coverage of the ‘Challenger’ parties in historical perspective
Minor parties matter in this campaign, and not just because of the closeness of the contest and the role they might play in any future coalition. There has been a long term reduction of support for the two major parties, spanning decades. In the 1964 General Election, Labour and Conservatives secured 88 percent of the vote. In 2010, this figure reduced to 65 percent. Time will tell if we are to witness a step-change this time around. What is new is the ‘fragmentation’ and ‘polarisation’ of UK politics with UKIP outflanking the Conservatives to the right and the Green party and others outflanking Labour to the left. This offers the promise of greater political pluralism and a broadening of the political debate away from a competition for the centre ground between the 3 main parties.
Our week-on-week analysis shows that the presence of these parties has been more or less sustained, despite the seven-way leaders’ debate disappearing over the event horizon. Between 30 March and 8 April, the SNP, Plaid Cymru, Greens, UKIP and other minor parties accounted for 22% of all politicians. Between 9 April and 15 April, this figure reduced, but only marginally, to 18%. It will be interesting to see the extent to which the BBC1 Challengers’ debate on 16 April will reverse this reduction in the coming week.
How significant are the inroads currently achieved into the 2015 media election? One way of gaining perspective is to compare the current amount of with the levels found in previous General Elections campaigns (see figure 2.1).

(Source: Loughborough University Communication Research Centre)
The results show
- There is nothing unprecedented in the current marginalisation of Plaid Cymru or the Greens. Their low media profile is entirely consistent with the modest levels attained in the previous three General Elections.
- The dramatic difference is in the amount of coverage given to the SNP and UKIP. Their prominence so far this year exceeds dramatically anything they have previously attained.
Section 3: Issue Balance
Table 3.1: Issues in the News, Weeks 1 and 2
| Themes 9 April – 15 April | Themes 30 March – 8 April | ||
| 1 | Election Conduct/Citizen Engagement/Parties | 39.5% | 40.6% |
| 2 | Economy | 10.7% | 10.3% |
| 3 | Taxation | 9.3% | 7.9% |
| 4 | Housing | 5.7% | .3% |
| 5 | Defence/Military | 5.1% | 1.1% |
| 6 | NHS | 3.8% | 4.6% |
| 7 | Women | 3.2% | 1.3% |
| 8 | Standards/Corruption/Sleaze | 2.5% | 2.4% |
| 9= | Immigration/Minorities/Religion | 2.3% | 4.3% |
| 9= | Arts/Culture/Sport | 2.3% | .1% |
| 11 | Employment | 2.2% | 5.9% |
| 12 | Constitutional issues | 2.1% | 3.5% |
| 13= | Business | 1.8% | 4.7% |
| 13= | Transport | 1.8% | .4% |
| 15 | Europe | 1.5% | 5.5% |
| 16 | Education | 1.2% | 1.2% |
| 17 | Social Security | 1.1% | 2.5% |
| 18 | Public Services | 1.0% | .1% |
| 19 | Media | .9% | 1.0% |
| 20 | Higher/Further Education | .7% | .3% |
| 21= | Environment | .5% | .5% |
| 21= | Crime/Law and order | .5% | .1% |
| 23 | Health | .3% | .7% |
| 24= | Foreign Policy | .0% | .3% |
| 24= | Farming/Agriculture | .0% | .2% |
| 24= | Information Technology | .0% | .1% |
Note: Percentages=number of appearances of theme /total appearances of all themes
Media coverage of the General Election continues to be dominated by discussion of the ‘horse race’, the conduct of the campaign itself (this has a number of discrete components containing, for example, discussion of the leadership debates, opinion polls, campaigning strategies, and the extent of citizens’ engagement in the election). Around 40% of the coded themes related to the electoral process registering little change in the second week of the campaign.
In terms of actual policy, the economy and taxation are clearly the most covered issues making up 20% of the issues coded in the second week, a slight increase on last week.
Other issues that received more prominence this week were all heavily featured in the manifestos of the parties. Issues to receive significantly increased coverage relative to others this week were housing, defence, and women. Such coverage reflects the competing priorities of the parties as they seek to reach out beyond their core support and attract floating voters. The Conservative Manifesto launch laid out a ‘right to buy’ policy for housing association tenants; Nigel Farage promised to make ‘defending the realm’ his first priority and force the Conservatives to spend more on the military if UKIP enjoys future influence; and the Labour Party launched a separate Manifesto for Women.
The issues receiving relatively less attention this week include employment, business, the NHS, Europe and constitutional issues. The first week of the contest saw the major parties trading blows on issues related to the economy: Labour claims about the immorality of ‘zero hours’ contracts were countered by an intervention of business leaders writing a letter in support on Conservative economic policy to The Daily Telegraph. Nicola Sturgeon’s performance in the leadership debate and the strong SNP showing in opinion polls led Conservatives to make claims about the negative consequences for the UK of a post-election agreement between Labour and the SNP.
Much has been made so far in the election coverage of the break-up of the two or three party system and the advent of a multi-party democracy. While there is some evidence of this in terms of media access and presence of the parties, there is little evidence in terms of a broadening of the issues covered. Coverage of environmental issues, which might be of benefit to the Green Party, is minimal. Coverage of immigration, which is a key concern of the electorate according to opinion polls and clearly associated with UKIP, received the same amount of media attention as art, culture and sport. On the one hand, it appears that both Labour and Conservative Parties do not wish to raise the issue; on the other, UKIP appear to be trying to extend their appeal through highlighting policies in addition to immigration.
Section 4: Who was in the spotlight?
As the issues have shifted, so has the roster of politicians, even if some figures are hogging the limelight. Table 4.1 provides this week’s ‘top twenty’ list of politicians, indicating the percentage of items across all media that featured them.
The ‘Top Twenty’ of media appearances (9 April- 15 April)
| Position | % of party politicians featured week 2 | Position compared with first sample week | |
| 1 | David Cameron (Cons) | 36% | Non-mover |
| 2 | Ed Miliband (Labour) | 35.1% | Non-mover |
| 3 | Nick Clegg (Lib Dem) | 14.7% | Non-mover |
| 4 | George Osborne (Cons) | 11.2 | +1 |
| 5 | Nigel Farage (UKIP) | 10.8 | -1 |
| 6 | Michael Fallon (Cons) | 7.8 | Highest New Entry |
| 7 | Nicola Sturgeon (SNP) | 7.6 | -1 |
| 8 | Ed Balls (Labour) | 6.3 | -1 |
| 9 | Natalie Bennett (Greens) | 3.7 | +11 |
| 10 | Jim Murphy (Labour) | 2.4 | +1 |
| 11 = | Harriet Harman (Labour) | 2.2 | New entry |
| 11= | Suzanne Evans (UKIP) | 2.2 | New entry |
| 13 | Tony Blair (Labour) | 2.1 | -5 |
| 14 | Boris Johnson (Cons) | 1.9 | +1 |
| 15= | Justine Thornton (Labour) | 1.5 | New entry |
| 15= | Theresa May (Cons) | 1.5 | New entry |
| 17 | Gordon Brown (Labour) | 1.3 | +3 |
| 18= | Nicky Morgan (Cons) | 1.1 | New entry |
| 18= | Chuka Umunna (Labour) | 1.1 | -6 |
| 18= | Patrick O’Flynn (UKIP) | 1.1 | New entry |
Note: percentages=total appearances of politicians/ number of news items
The results show:
- In the second week of the campaign the leaders of the two main political parties became even more prominent. Both David Cameron and Ed Miliband featured in over one third of items with Miliband making up ground on Cameron.
- The relative visibility of Nigel Farage declined, overtaken by George Osborne who appeared in almost twice as many items as the Shadow Chancellor, Ed Balls.
- Farage’s fall was not quite made up for by increased visibility for UKIPers Suzanne Evans and Patrick O’Flynn.
- Nick Clegg continues to punch above his weight with respect to his party’s showing in the opinion polls but Danny Alexander drops out of the chart.
- The highest new entry was Michael ‘the hatchet man’ Fallon with his O’Jays cover ‘back-stabber’ attack on Ed Miliband. Time will tell if this is a one-hit wonder.
- The picture was mixed for women. Natalie Bennett, Green Party leader, climbs eleven moving into the top ten with Harriet Harman, Suzanne Evans, Theresa May, and Justine Thornton bubbling under. Samantha Cameron, Lucy Powell, and Leanne Wood drop out of the top twenty but they might make a comeback next week.
- Top of the alternative charts is George Galloway with Respect on two mainstream media appearances (0.4%) and TUSC’s Dave Nellist on one (0.2%).
- Election coverage is dominated by white people with only Chuka Umunna scraping into the top twenty.
- 13 of the top twenty were educated at fee-paying schools while Oxford University easily beats Cambridge in the electoral boat race 8-3.
Section 5: Where are the women?
The under-representation of women in election coverage and the campaign has been a perennial complaint.
Are we about to witness a change in 2015? Are there grounds for guarded optimism? There are 7 women in our top twenty this week. Three of the seven parties are led by women. David Cameron’s last government reshuffle saw 10 women promoted, with 5 of the 17 full Tory cabinet ministerial posts occupied by women.
So what is the gender composition of election news coverage so far in 2015?
Women can appear in a range of different contexts in election news: as candidates, spouses, citizens, experts or representatives of public and private agencies. Figure 5.1 combines all these categories and compares what proportion of all news sources are women in this campaign. This statistic is compared with levels found in previous general elections.

(Source: Loughborough University Communication Research Centre)
The results show there has been an increase in the relative prominence of women in 2015. Even so, less than one in 5 individuals appearing in campaign coverage so far are women.
This general statistic obscures some important distinctions. Figure 5.2 analyses the relative prominence of by different type of news source.

The results show:
- Women politicians only accounted for 14.3% of all politicians covered
- Women were also rarely included in coverage in assorted professional capacities (e.g. as public sector professionals, business representatives, expert commentators)
- Women were reported prominently in their capacity as electors and citizens, but even here they didn’t quite manage to attain equivalence with men (46.5%)
- The one category women did dominate was that of politician’s relative.
Background information
This research is funded by a grant from the British Academy/ Leverhulme Trust
The Loughborough Communication Research Centre (LCRC), based at the Department of Social Sciences, Loughborough University, has substantial experience of conducting media content audits. It has worked closely with a range of funding bodies, charities and the public sector organisations including: the BBC Trust, Ofcom, The Guardian and the Electoral Commission.
Since 1992, it has conducted an analysis of news coverage of the British general election campaign.
The LCRC draws on the experience of its members who are leading international media and political analysts who have published widely in the fields of communication research and methodology. The LCRC has no links with any political parties or interest groups, nor has it conducted research or consultancy on behalf of organisations that could be categorised in these terms. See https://blog.lboro.ac.uk/general-election/.
Inter-coder reliability
Ensuring reliability between coders is an essential aspect of any project involving content analysis and especially in large scale projects such as this. For the results of any content analysis to be deemed reliable there needs to be a high level of agreement between two or more coders when coding the same news item. This research ensures such levels of reliability are achieved through a number of measures. 1, using post-doctoral researchers and doctoral students working in the LCRC whose research concerns the media; 2, providing rigorous coder training prior to the analysis; 3, conducting a close monitoring of coders during the campaign; and 4, conducting reliability tests and addressing any areas of weakness these expose.