Loughborough Online Reading List System
Posts tagged statistics
Academic dashboard in beta
22 Jun 2012
 One area of discussion at last year’s Meeting the reading list challenge workshop was around the sort of statistics that academics would like about their reading lists. Since then we have put the code in to log views of reading lists and other bits of information.
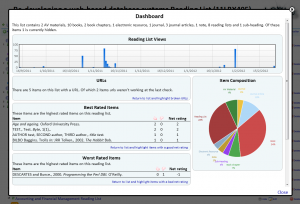
2 months ago, having collected 10 months of statistics we decided to put together a dashboard for owners of reading lists. The current beta version of the dashboard contains the following information
- Summary – a quick summary of the list and the type of content on it
- Views of the reading list – how many people have viewed the list
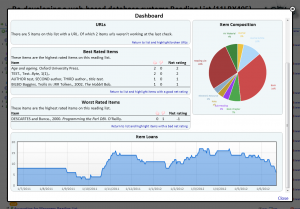
- URLs – Details of the number of items on the list with a URL, and details of any URLs that appear to be broken (with a option to highlight those items with broken URLs on the reading list)
- Best rated items – the top user rated item on the list (again with an option to highlight those items on the reading list)
- Worst rated items – the lowest user rated items on the list (yet again with an option to highlight those items on the reading list)
- Item Composition – a graphical representation of the types of items on the reading list
- Item Loans – a graph showing the number of items from the reading list loaned out by the Library over the past year.
