Media coverage of the 2017 General Election campaign (report 3)
Report 3 (covering 18th-31st May inclusive)
This is the third report by the Centre for Research in Communication and Culture on national news reporting of the 2017 UK General Election.
The results in this report are derived from detailed content analysis of election coverage produced on the weekdays (i.e. Monday to Friday inclusive) between 18th and 31st May 2017 from the following news outlets:
Television: Channel 4 News (7pm), Channel 5 News (6.30pm), BBC1 News at 10, ITV1 News at 10, Sky News 8-8.30pm
Press: The Guardian, The I, The Daily Telegraph, The Times, The Financial Times, The Daily Mail, The Daily Express, The Mirror, The Sun, The Star
We analysed all election news found in the television programmes. For the press, we included election news found on the front page, the first two pages of the domestic news section, the first two pages of any specialist election section and the page containing and facing the papers’ leader editorials. More information can be found at here[1]
In this report we focus on the following features of news coverage during the third and fourth weeks of the formal campaign: 1, the visibility or presence of the different political parties and other organizations and individuals in the news; 2, the most frequently reported political figures; 3, the positivity and negativity of press reporting of the main parties; and 4, which issues attracted most media attention.
Intercoder reliability tests were conducted on all key variables.[i]
The sample dates for Week 3 were 18th, 19th, 22nd, 23rd, and 24th May 2017, inclusive.
The sample dates for Week 2 were 25th, 26th,29th, 30th, and 31st May, inclusive.
Executive summary
- A key finding of our third report is that the Conservative Party lost control of the issue agenda in week 3 of the campaign as health and health care displaced Brexit as the most covered substantive issue.
- In addition, the greater prominence of social security in week 3 as an issue would suggest that the Labour Party began to fight the General Election on its territory rather than on Conservative ground.
- There was also considerably more negative coverage of the Conservative Party in comparison to the first two weeks although this was largely confined to lower circulation newspapers. Most of the negative coverage focussed on the ‘dementia tax’ and on what the handling of the issue says about Teresa May’s claim to provide ‘strong and stable leadership’.
- The third week of the formal campaign saw a marked emphasis in terms of coverage on the Conservative Party as they launched their manifesto but week 4 saw a return to two party equivalence at least in terms of amount of coverage.
- Week 4 also saw a renewed emphasis on Brexit as the Conservatives sought to retake the initiative.
- In the aftermath of the Manchester bombing defence issues rose greatly in prominence as did the prominence of Amber Rudd, Home Secretary, and Diane Abbott, her Shadow.
- There was substantial continuity in terms of personnel. This is a highly presidentialised campaign with the Conservative campaign, in particular, engaging in ad hominem attacks on Jeremy Corbyn. Philip Hammond, the Chancellor the Exchequer has been remarkably absent in a Conservative campaign despite its focus on the affordability of Labour’s spending plans.
- Our measures of the direction of press reporting of Labour show that a majority of this coverage has continued to be critical of the party and its manifesto but that the gap between negative and positive coverage is diminishing, which suggests that the Labour Party is gaining momentum in at least some parts of the media.
- As a general trend, newspapers have focused more coverage on attacking the parties they disapprove of than on reporting positive issues connected to the parties they support. There has been considerable coverage of ‘political gaffes’ and ‘Omni-shambles’ such as policy U-turns and failing to have facts to hand during interviews.
Section 1: Presence of political parties in news coverage
Figures 1.1 and 1.2 compare the frequency with which the main political parties appeared in TV news in weeks 3 and 4 of the campaign respectively. Figures 1.3 and 1.4 provide an equivalent comparison for newspaper coverage.
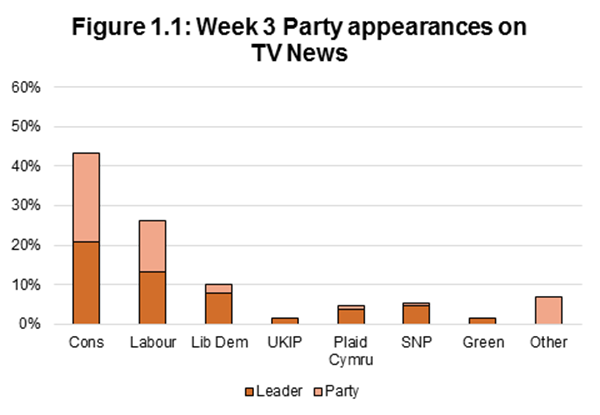
Figure 1.1: Week 3 Party appearances on TV News
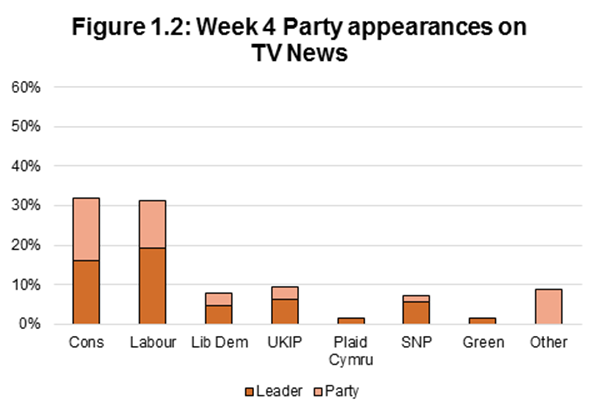
Figure 1.2: Week 4 Party appearances on TV News
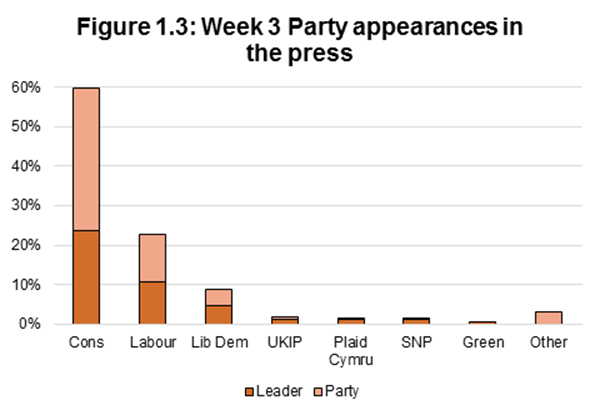
Figure 1.3: Week 3 Party appearances in the press
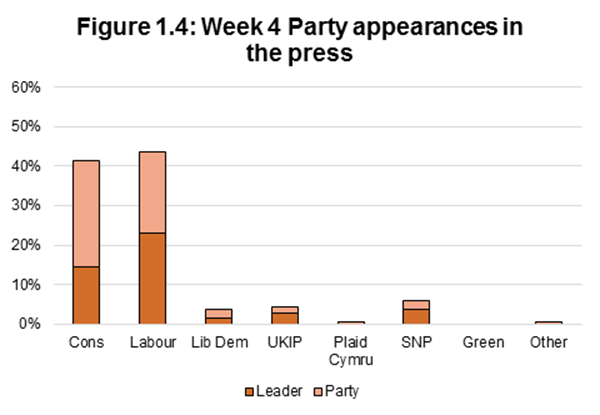
Figure 1.4: Week 4 Party appearances in the press
Key findings
- Week 3 of the campaign was dominated by the launch and fall-out from the Conservative manifesto.
- This was especially noticeable in the press, in which the party and its leader constituted 60% of all party political media appearances.
- In week 4, the two main parties returned to broad parity in both TV and press terms, maintaining their collective dominance over the debate.
- In terms of the smaller parties, despite the two-party squeeze, UKIP and the SNP made slight gains in appearance terms in week 4.
Section 2: most prominent political figures in coverage (weeks 3 and 4)
Table 2.1 and Table 2.2 identify the most frequently reported political figures in the third and fourth week of coverage. It also compares their position in the previous week’s sample.
Table 2.1: Most prominent figures in Week 3 coverage (last week in brackets)
| Position | Political figure | % |
|---|---|---|
| 1 (2) | Theresa May (Cons) | 36.3% |
| 2 (1) | Jeremy Corbyn (Lab) | 17.7% |
| 3 (4) | Tim Farron (Lib Dem) | 8.5% |
| 4 (15) | Boris Johnson (Cons) | 7.1% |
| 5 (11) | Philip Hammond (Cons) | 4.0% |
| 6 (7) | Nicola Sturgeon (SNP) | 2.8% |
| 7 (-) | Jeremy Hunt (Cons) | 2.6% |
| 8 (-) | Caroline Lucas (Green) | 2.6% |
| 9 (-) | Damian Green (Cons) | 2.4% |
| 10 (10) | Paul Nuttall (UKIP) | 2.1% |
| 11 (-) | David Davis (Cons) | 1.7% |
| 12 (-) | Ruth Davidson (Cons) | 1.4% |
| 13 (3) | John McDonnell (Lab) | 1.2% |
| 14 (19) | Angela Rayner (Lab) | 1.2% |
| 15 (14) | Leanne Wood (PC) | 1.2% |
| 16 (-) | Tony Blair (Lab) | 1.2% |
| 17 (-) | Nick Clegg (Lib Dem) | 0.9% |
| 18 (13) | David Cameron (Cons) | 0.9% |
| 19 (17) | Diane Abbott (Lab) | 0.7% |
| 20 (-) | Amber Rudd (Cons) | 0.7% |
Note: percentages=(number of appearances/ number of items)*100
Table 2.2: Most prominent figures in Week 4 coverage (last week in brackets)
| Position | Political figure | % |
|---|---|---|
| 1 (2) | Jeremy Corbyn (Lab) | 35.9% |
| 2 (1) | Theresa May (Cons) | 24.1% |
| 3 (19) | Diane Abbott (Lab) | 7.9% |
| 4 (6) | Nicola Sturgeon (SNP) | 7.0% |
| 5 (10) | Paul Nuttall (UKIP) | 6.0% |
| 6 (20) | Amber Rudd (Cons) | 6.0% |
| 7 (3) | Tim Farron (Lib Dem) | 3.8% |
| 8 (4) | Boris Johnson (Cons) | 3.8% |
| 9 (12) | Ruth Davidson (Cons) | 3.2% |
| 10 (-) | Michael Fallon (Cons) | 2.2% |
| 11 (-) | Priti Patel (Cons) | 1.9% |
| 12 (13) | John McDonnell (Lab) | 1.6% |
| 13 (-) | Emily Thornberry (Lab) | 1.6% |
| 14 (-) | Dominic Raab (Cons) | 1.3% |
| 15 (-) | Karen Bradley (Cons) | 1.3% |
| 16 (-) | Suzanne Evans (UKIP) | 1.3% |
| 17 (11) | David Davis (Cons) | 1.0% |
| 18 (-) | Donald Trump (USA) | 1.0% |
| 19 (-) | Patrick McLoughlin (Cons) | 1.0% |
| 20 (-) | Arlene Foster (DUP) | 1.0% |
Note: percentages=(number of appearances/ number of items)*100
Key findings
- Theresa May and Jeremy Corbyn continued to occupy the 1st and 2nd position in the campaign through weeks 3 and 4 in what has been as a highly presidentialised campaign.
- Other party leaders appearing within the top 20 of each week in the past fortnight include Tim Farron, Nicola Sturgeon, Caroline Lucas, Paul Nuttall, Leanne Wood and Arlene Foster.
- Two former Prime Ministers, Tony Blair and David Cameron, also appeared in the third week of the campaign.
- The Home Secretary Amber Rudd and Shadow Home Secretary Diane Abbott were notably more prominent in week 4 in the aftermath of the Manchester bombing.
- The Chancellor of the Exchequer, Philip Hammond, continues to play a remarkably reserved role in the campaign, appearing on a number of occasions in the week of his party’s manifesto but disappearing from coverage in the fourth week.
Section 3: Positive and negative treatment of the political parties in the press
In this section we discuss the overall positivity or negativity of newspaper coverage. For each item we assessed whether the information or commentary contained within it had positive or negative implications for each political party[2].
Scoring
If an item mainly or solely focused on positive matters for a party, it was given a value of +1. If it mainly/ solely focused on negative matters for a party, it was assigned a value of -1. Items where there was no clear evaluation, or contained positive and negative issues in broadly equal measure, were coded as zero. Items where no reference was made to the party were excluded from the calculation.
The scores in Figures 3.1 and 3.2 are calculated by subtracting the total number of negative stories from the total of positive stories.
Figure 3.1 shows the overall directional balance of newspaper stories of the respective parties in the two fortnights, or halves, of the campaign so far.
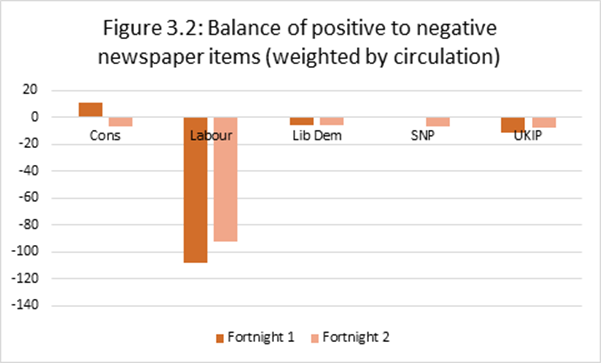
Figure 3.2 weights this differential by the latest ABC circulation figures for each national newspaper.
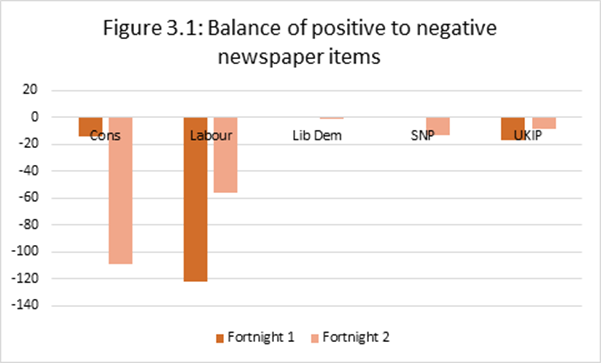
Figure 3.1: Balance of positive to negative newspaper items
Key findings
- The unweighted figures show that all parties received more negative press coverage than positive in the second fortnight of the campaign.
- Whereas in the first fortnight for the Conservatives there was only a small difference between levels of positive and negative coverage across all newspapers, during the second fortnight coverage became much more critical.
- While for the Labour party, in contrast, negative press coverage continued to exceed positive coverage but to a lesser extent than in the first fortnight.
- The small variations in coverage of the Lib Dems, SNP and UKIP are to a large extent a measure of their marginal presence.
- When the different circulations of the national newspapers are taken into account, Conservative coverage moves into a negative position in the second fortnight in comparison to a positive position in the first fortnight.
- The difference between the coverage of the two parties according to this weighted measure has been reduced in the last two weeks of the campaign.
- The differences between the unweighted and weighted measures are because the larger circulation papers have tended to be more muted in their criticism of the Conservative Party than smaller circulation papers.
Section 4: Issues in the Media Campaign
Table 4.1 compares the prominence of the most prominent 10 issues in the media across the four weeks of the campaign so far.
| Place | Issue | Week 1 | Week 2 | Week 3 | Week 4 |
|---|---|---|---|---|---|
| 1 | Electoral process | 38.3% | 30.8% | 29.2% | 31.8% |
| 2 | Brexit/European Union | 16.3% | 8.4% | 6.4% | 10.8% |
| 3 | Health and health care provision | 3.4% | 6.2% | 11.3% | 6.5% |
| 4 | Taxation | 4.6% | 8.6% | 7.5% | 3.0% |
| 5 | Economy/Business/Trade | 6.9% | 7.6% | 5.8% | 2.7% |
| 6 | Defence | 1.1% | 4.7% | 3.6% | 14.1% |
| 7 | Social Security | 2.9% | 3.3% | 11.1% | 3.3% |
| 8 | Education | 2.8% | 2.7% | 4.3% | 4.3% |
| 9 | Immigration | 4.6% | 2.0% | 3.8% | 2.5% |
| 10 | Standards in public life | 4.9% | 3.6% | 1.9% | 1.9% |
Table 4.1: Ten Most Prominent Issues in Coverage (% of responses)
Figure 4.1 charts the development in prominence of the top 5 policy issues in the 4 weeks of the campaign so far.
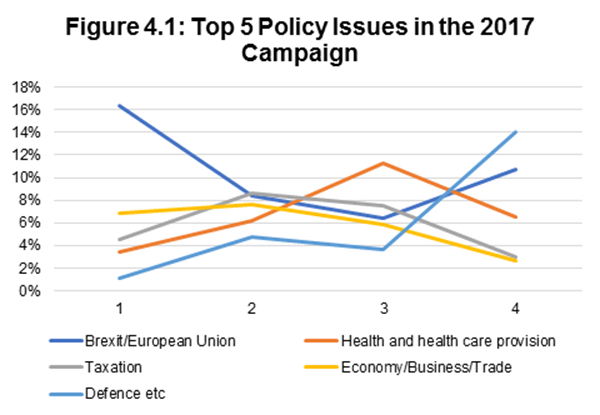
Figure 4.1: Top 5 Policy Issues in the 2017 Campaign
Key findings
- Although slightly down from the first two weeks, the main focus of TV news and press coverage remained the electoral process and what the final ballot might mean for the prospects of each of the parties.
- Attention switched away from Brexit, down from 16% from week 1 to around 8% in week 2, dipping again in week 3 to 6% before switching back in week 4 to 11%.
- Brexit was displaced as the main substantive issue by health and health care in week 3.
- Conservative disarray on social care plans have been widely criticised and this is clearly good news for Labour.
- The issue of social security also rose in prominence in the third week of the campaign, again good news for the Labour campaign. In the aftermath of the Manchester bombing the issue of defence gained in prominence.
Table 4.2 compares the prominence of issues in the media between TV news and the press across the past two weeks of media coverage.
Table 4.2: Ten Most Prominent Issues in Coverage, weeks 3 and 4 (% of responses, TV compared to Press)
| Rank | Issue | TV | Issue | Press |
|---|---|---|---|---|
| 1 | Electoral process | 31.2 | Electoral process | 30.0 |
| 2 | Defence | 9.3 | Health and health care provision | 9.7 |
| 3 | Brexit/European Union | 9.1 | Social Security | 8.6 |
| 4 | Health and health care provision | 7.7 | Brexit/European Union | 8.1 |
| 5 | Devolution | 7.7 | Defence | 7.8 |
| 6 | Public services | 6.4 | Taxation | 6.7 |
| 7 | Social Security | 5.1 | Economy/Business/Trade | 4.4 |
| 8 | Education | 4.8 | Education | 4.1 |
| 9 | Economy/Business/Trade | 4.5 | Immigration | 3.1 |
| 10 | Immigration | 3.7 | Other | 2.7 |
Key findings
Despite being a very prominent issue, and in one week the most prominent issue, in the 2016 EU referendum immigration has remained a relatively marginal issue thus far in the 2017 General Election.
[1] Our thanks to our coding team: Shani Burke, Gennaro Errichiello, Simon Huxtable, Jack Joyce, Herminder Kaur, Jade Markham, Nathan Ritchie, Lukas Stepanek, Ian Taylor, Rosie Tinker and Lou Tompkins
[2] This is not solely a measure of overt support or criticism by a journalist of a party (although these instances would be included in the count). It is a broader measure of the extent to which newspapers report on issues/ comments/ developments that have positive or negative implications for parties. We only coded these instances where these were overtly referred to in the piece.
[i] Inter-coder reliability UK General Election 2017 campaign analysis
A reliability test using a random sample of 11 newspaper stories was conducted early on in the coding process with 10 coders. It is customary to provide an inter-coder reliability measure for each variable on a coding sheet. We have focused here on the more subjective variables that require coder judgement and the scores below are for these variables on the coding sheet.
Two measures are used, average pairwise percent agreement (APPA) and Krippendorff’s Alpha. Given the number of coders and the amount of training time ahead of this snap election our confidence level was set at 70% for APPA and 60% for Krippendorff’s Alpha.
The identity of actors in the news: APPA 78.324%; Krippendorff’s Alpha, 0.733776976662
Disposition of actors in the news: APPA, 72.9761904762% Krippendorff’s Alpha. 0.633986079743
The themes of news items: APPA, 76.2962962963%; Krippendorff’s Alpha, 0.684490950537
Overall story evaluation: APPA, 86.7824074074%; Krippendorff’s Alpha, 0.644939179375