Skip to content

Menu

Copyright Teaching and Learning Blog 2025 | Theme by ThemeinProgress | Proudly powered by WordPress

Teaching and Learning BlogIncorporating the E-learning Blog

Biting the Bullet: ending Death by PowerPoint, part 5: numbers, statistics

March 26, 2014Uncategorized Standard

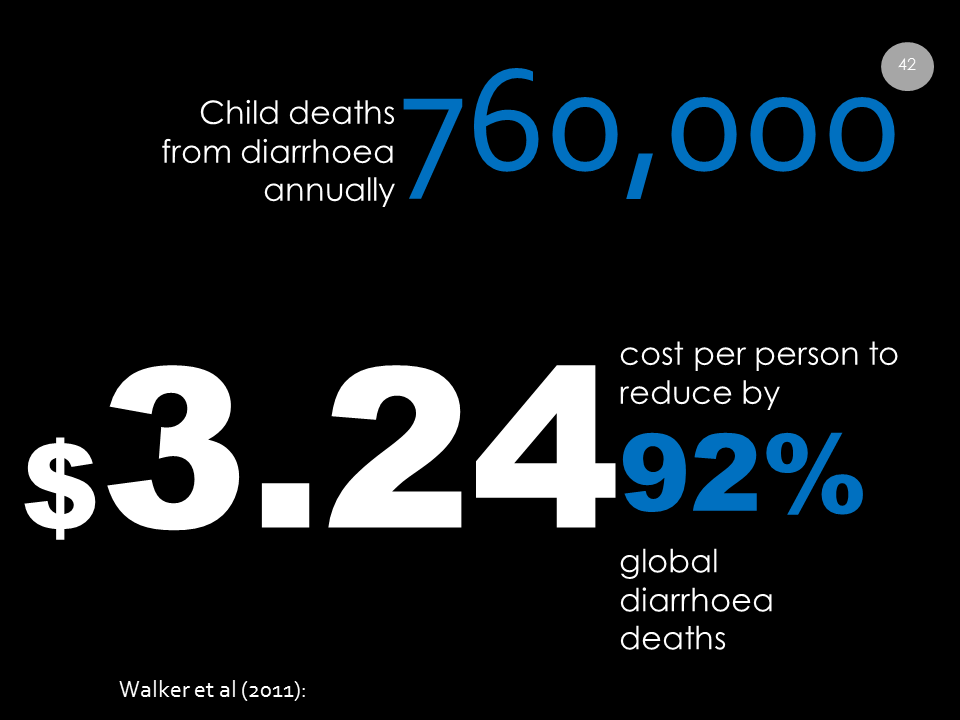
This is probably the least well done aspect of my PPT material. This said, it’s better than it used to be. There are ways to make numbers or statistics more appealing visually, but it gets harder the more numbers you have to include. At some point, you have to head for Infographics or stay with old-fashioned PPT if there is just too much data. But in my field, it’s mostly manageable. Some of that concerns child mortality, medical and military. This is how I presented the numbers of infant deaths due to mortality.

Stats example 3

The insect image was a free education download from the UNICEF site. Associating images with numbers is claimed to lead to better recall. But it isn’t the only way to make a mass of numbers look less bland.

Stats example 2

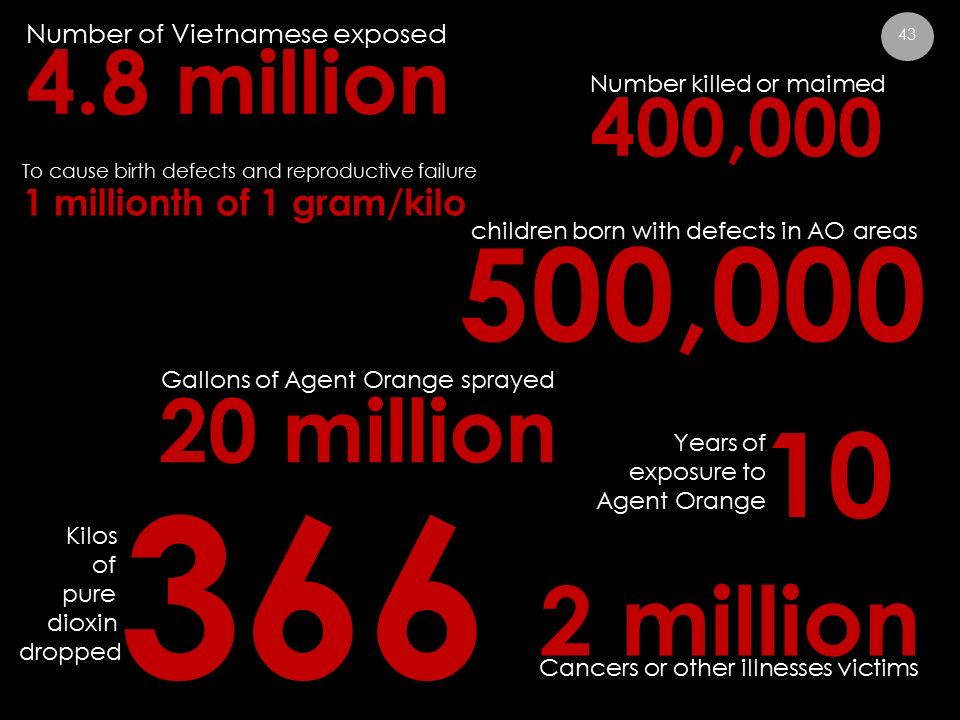
By using different font sizes and text colours, and adding animations, I had attention and interest. I can’t show it here, but the white text might wipe in from left at the same time as the numbers dropped in from above. You can do pretty much anything you’d need to.

Stats example 1

There’s a way of making large tables less oppressive or intimidating, and more visually appealing. It’s pretty simple, involving placing shapes the breadth of the table over sections of the table and applying an animation to them, to make them reveal, on click, each level of the table. It isn’t brilliant but it allows you to focus on one layer at a time.

Categories

  • Academic misconduct
  • Academic skills
  • Accessibility
  • Adobe Connect
  • AR
  • Assessment
  • Assessment and feedback
  • Audio
  • Blackboard Collaborate
  • Blended learning
  • BoB Box of Broadcasts
  • Camtasia
  • Case Studies
  • Co-Tutor
  • Collaboration
  • Comment piece
  • Communications
  • Conferences
  • Copyright
  • CPD
  • Current Projects
  • Digital literacy
  • Distance learning
  • E-portfolios
  • Electronic Voting
  • Elluminate
  • Employability
  • Engagement
  • Evaluation
  • Events
  • Excellence in Teaching and Learning
  • Facebook
  • Feedback
  • Fieldwork
  • Flipped classroom
  • Funding
  • Futurelearn
  • Gamification
  • General
  • Groupwork
  • HE trends
  • HEA
  • Images
  • Informal learning
  • Innovation
  • iPads
  • JISC
  • Learn
  • Lecture capture
  • LectureTools
  • Lecturing to large groups
  • Make History timelines
  • Microsoft Teams
  • Minimum Presence
  • Mobile devices
  • Module and curriculum design
  • MOOCs
  • Moodle
  • New lecturers
  • NSS
  • OER
  • OMR
  • Online marking
  • Online submission
  • PDP
  • Pedagogic
  • Pedagogic research
  • Pedagogy
  • Peer Support
  • Personal tutoring
  • Plagiarism
  • Podcasting
  • Programme Reps
  • QR codes
  • Quiz
  • Reports
  • Research into e-learning
  • Researchers
  • ReVIEW (Echo 360)
  • RiTA
  • RITAs
  • Screen recording
  • Second Life
  • Smartpens
  • Social media
  • Staff Development
  • Standards
  • Strategy
  • Student-led curriculum
  • Support for students
  • Tablets
  • Teaching Awards
  • Teaching excellence
  • Teaching Innovation Awards
  • Teaching methods
  • Teaching room technologies
  • Teaching rooms
  • TechWatch
  • Tools
  • Turnitin
  • Twitter
  • Uncategorized
  • Vacancies
  • Vevox
  • Vice Chancellor's Award
  • Video
  • Web 2.0
  • Web Conferencing
  • WebPA
  • widening participation

Recent Posts

  • New Office 365 training service
  • Celebrating the RiTA and TIA Award Winners for 2020
  • 5 Top tips for Microsoft Teams
  • Using the new leaderboard feature in Vevox
  • Tips and Tricks for using Office 365

Categories

Meta

  • Log in
  • Entries feed
  • Comments feed
  • WordPress.org